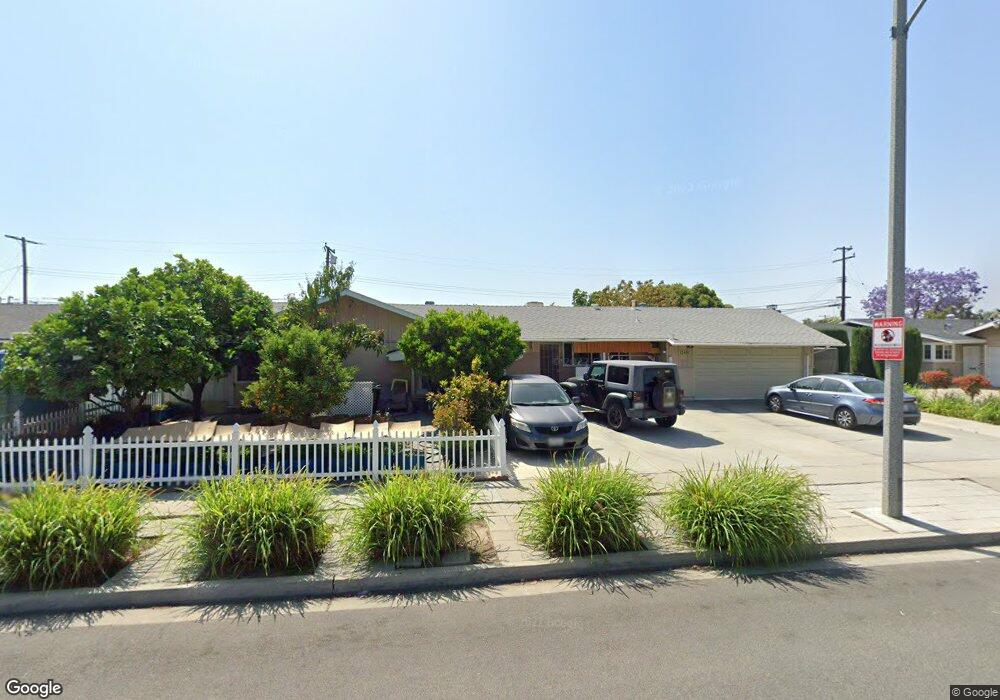
11431 Dolan St Garden Grove, CA 92840
Estimated Value: $988,000 - $1,110,627
4
Beds
2
Baths
1,786
Sq Ft
$583/Sq Ft
Est. Value
About This Home
This home is located at 11431 Dolan St, Garden Grove, CA 92840 and is currently estimated at $1,041,407, approximately $583 per square foot. 11431 Dolan St is a home located in Orange County with nearby schools including Faylane Elementary School, Lake Intermediate School, and Rancho Alamitos High School.
Ownership History
Date
Name
Owned For
Owner Type
Purchase Details
Closed on
Jun 29, 2024
Sold by
Carlson Brent H and Pham-Carlson Phuong Tuyet
Bought by
Brent H Carlson And Phuong Tuyet Pham-Carlson and Carlson
Current Estimated Value
Purchase Details
Closed on
Jun 9, 2021
Sold by
Carlson Brent and Carlson Phuong
Bought by
Carlson Brent and Pham Carlson Phuong
Home Financials for this Owner
Home Financials are based on the most recent Mortgage that was taken out on this home.
Original Mortgage
$238,000
Interest Rate
2.9%
Mortgage Type
New Conventional
Purchase Details
Closed on
Jan 28, 2003
Sold by
Morawski Christopher and Morawski Izabela
Bought by
Carlson Brent and Carlson Phuong
Home Financials for this Owner
Home Financials are based on the most recent Mortgage that was taken out on this home.
Original Mortgage
$265,600
Interest Rate
5.93%
Purchase Details
Closed on
May 22, 2000
Sold by
Szczucki Wojtek and Szczuki Wojtek
Bought by
Morawski Christopher and Morawski Izabela
Create a Home Valuation Report for This Property
The Home Valuation Report is an in-depth analysis detailing your home's value as well as a comparison with similar homes in the area
Home Values in the Area
Average Home Value in this Area
Purchase History
| Date | Buyer | Sale Price | Title Company |
|---|---|---|---|
| Brent H Carlson And Phuong Tuyet Pham-Carlson | -- | None Listed On Document | |
| Carlson Brent | -- | Provident Title Company | |
| Carlson Brent | $332,000 | Commonwealth Title | |
| Morawski Christopher | -- | Commonwealth Land Title |
Source: Public Records
Mortgage History
| Date | Status | Borrower | Loan Amount |
|---|---|---|---|
| Previous Owner | Carlson Brent | $238,000 | |
| Previous Owner | Carlson Brent | $265,600 |
Source: Public Records
Tax History Compared to Growth
Tax History
| Year | Tax Paid | Tax Assessment Tax Assessment Total Assessment is a certain percentage of the fair market value that is determined by local assessors to be the total taxable value of land and additions on the property. | Land | Improvement |
|---|---|---|---|---|
| 2025 | $6,696 | $555,111 | $381,731 | $173,380 |
| 2024 | $6,696 | $544,227 | $374,246 | $169,981 |
| 2023 | $6,570 | $533,556 | $366,907 | $166,649 |
| 2022 | $6,472 | $523,095 | $359,713 | $163,382 |
| 2021 | $6,406 | $512,839 | $352,660 | $160,179 |
| 2020 | $6,333 | $507,581 | $349,044 | $158,537 |
| 2019 | $6,175 | $497,629 | $342,200 | $155,429 |
| 2018 | $6,073 | $487,872 | $335,490 | $152,382 |
| 2017 | $5,988 | $478,306 | $328,911 | $149,395 |
| 2016 | $5,688 | $468,928 | $322,462 | $146,466 |
| 2015 | $5,616 | $461,885 | $317,619 | $144,266 |
| 2014 | $5,422 | $452,838 | $311,397 | $141,441 |
Source: Public Records
Map
Nearby Homes
- 11441 Dolan St
- 10691 Perrin Dr
- 11301 Euclid St Unit 109
- 11301 Euclid St Unit 60
- 10622 Tibbs Cir
- 11762 Gary St
- 1747 S Nutwood St
- 10221 Roselee Dr
- 11971 Medina Dr
- 2011 W Katella Ave Unit 61
- 12071 Diane St
- 2227 S Atlanta St
- 10072 Roselee Dr
- 10112 Becca Dr
- 1645 S Euclid St
- 11912 Brookhaven St Unit 65
- 1737 S Garden Dr
- 9901 Royal Palm Blvd
- 11552 9th St
- 11252 Chapman Ave
- 11411 Dolan St
- 11432 Baggett St
- 11442 Baggett St
- 11412 Baggett St
- 11401 Dolan St
- 11461 Dolan St
- 11432 Dolan St
- 11412 Dolan St
- 11402 Baggett St
- 11462 Baggett St
- 11442 Dolan St
- 11402 Dolan St
- 11462 Dolan St
- 11431 Baggett St
- 11441 Baggett St
- 11411 Baggett St
- 11392 Dolan St
- 11401 Baggett St
- 11461 Baggett St
- 10711 Perrin Dr