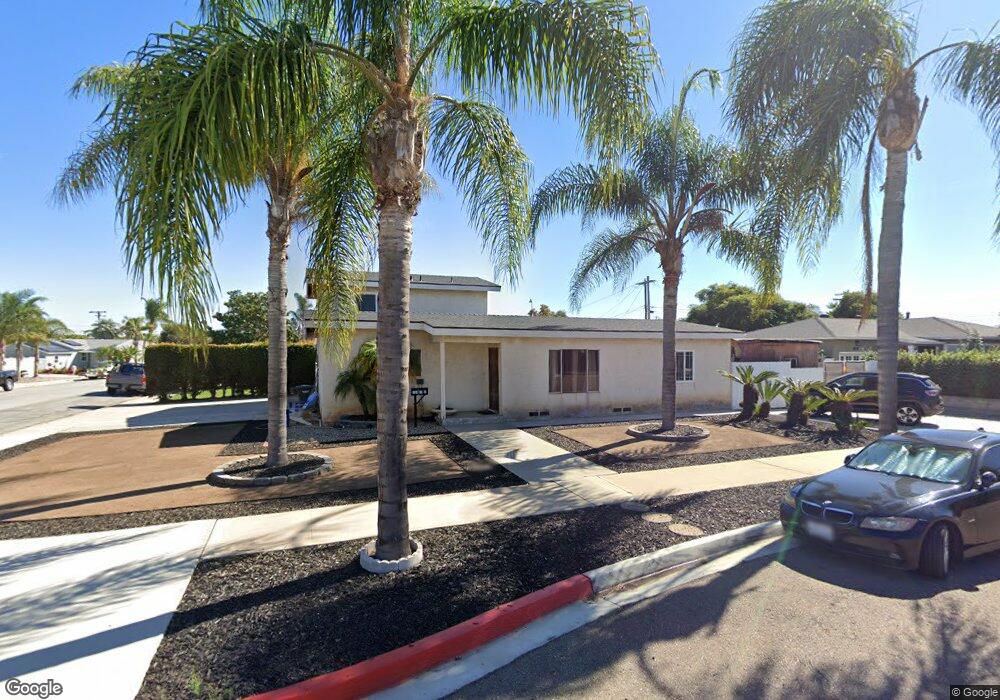
1144 8th St Imperial Beach, CA 91932
Estimated Value: $906,000 - $1,044,000
4
Beds
2
Baths
2,124
Sq Ft
$455/Sq Ft
Est. Value
About This Home
This home is located at 1144 8th St, Imperial Beach, CA 91932 and is currently estimated at $966,335, approximately $454 per square foot. 1144 8th St is a home located in San Diego County with nearby schools including Oneonta Elementary School, Mar Vista Academy, and Mar Vista Senior High School.
Ownership History
Date
Name
Owned For
Owner Type
Purchase Details
Closed on
Oct 15, 2009
Sold by
Diaz Frank Joseph
Bought by
Diaz Frank Joseph
Current Estimated Value
Home Financials for this Owner
Home Financials are based on the most recent Mortgage that was taken out on this home.
Original Mortgage
$50,000
Outstanding Balance
$32,516
Interest Rate
5%
Mortgage Type
Credit Line Revolving
Estimated Equity
$933,819
Purchase Details
Closed on
Aug 21, 2009
Sold by
Diaz Frank
Bought by
Diaz Frank Joseph
Home Financials for this Owner
Home Financials are based on the most recent Mortgage that was taken out on this home.
Original Mortgage
$50,000
Outstanding Balance
$32,516
Interest Rate
5%
Mortgage Type
Credit Line Revolving
Estimated Equity
$933,819
Purchase Details
Closed on
Feb 15, 1994
Sold by
Diaz Frank and Diaz Maria Luisa
Bought by
Diaz Frank
Home Financials for this Owner
Home Financials are based on the most recent Mortgage that was taken out on this home.
Original Mortgage
$30,000
Interest Rate
6.47%
Create a Home Valuation Report for This Property
The Home Valuation Report is an in-depth analysis detailing your home's value as well as a comparison with similar homes in the area
Home Values in the Area
Average Home Value in this Area
Purchase History
| Date | Buyer | Sale Price | Title Company |
|---|---|---|---|
| Diaz Frank Joseph | -- | Lawyers Title Co | |
| Diaz Frank Joseph | -- | None Available | |
| Diaz Frank | -- | Continental Lawyers Title |
Source: Public Records
Mortgage History
| Date | Status | Borrower | Loan Amount |
|---|---|---|---|
| Open | Diaz Frank Joseph | $50,000 | |
| Previous Owner | Diaz Frank | $30,000 |
Source: Public Records
Tax History
| Year | Tax Paid | Tax Assessment Tax Assessment Total Assessment is a certain percentage of the fair market value that is determined by local assessors to be the total taxable value of land and additions on the property. | Land | Improvement |
|---|---|---|---|---|
| 2025 | $2,233 | $152,463 | $26,304 | $126,159 |
| 2024 | $2,233 | $149,475 | $25,789 | $123,686 |
| 2023 | $2,212 | $146,545 | $25,284 | $121,261 |
| 2022 | $2,283 | $143,673 | $24,789 | $118,884 |
| 2021 | $2,207 | $140,856 | $24,303 | $116,553 |
| 2020 | $2,283 | $139,412 | $24,054 | $115,358 |
| 2019 | $2,214 | $136,680 | $23,583 | $113,097 |
| 2018 | $2,052 | $134,001 | $23,121 | $110,880 |
| 2017 | $140 | $131,374 | $22,668 | $108,706 |
| 2016 | $2,025 | $128,799 | $22,224 | $106,575 |
| 2015 | $2,111 | $126,866 | $21,891 | $104,975 |
| 2014 | $2,090 | $124,382 | $21,463 | $102,919 |
Source: Public Records
Map
Nearby Homes
- 1152 8th St
- 1167 Delaware St
- 1160 8th St
- 1207 Delaware St
- 1158 Delaware St
- 1208 8th St
- 1135 Delaware St
- 1150 Delaware St
- 1166 Delaware St
- 1151 8th St
- 1142 Delaware St
- 1214 8th St
- 1206 Delaware St
- 1215 Delaware St
- 1159 8th St
- 1134 Delaware St
- 1127 Delaware St
- 1220 8th St
- 1214 Delaware St Unit 2
- 1214 Delaware St Unit 1
Your Personal Tour Guide
Ask me questions while you tour the home.