1144 Isabelle St Memphis, TN 38122
Berclair NeighborhoodEstimated Value: $71,000 - $97,000
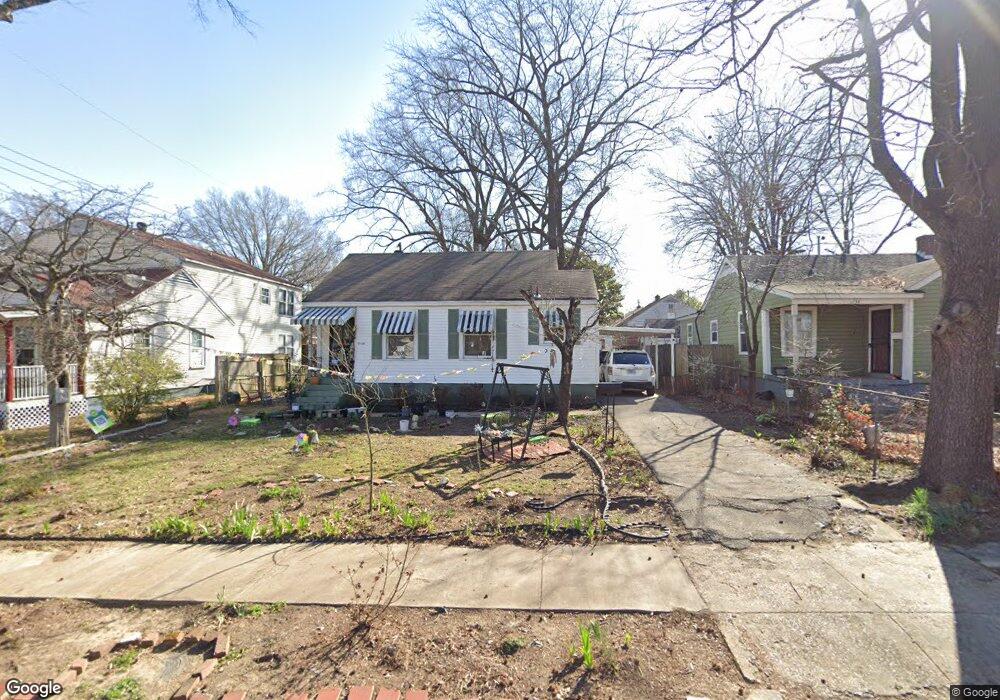
About This Home
This home is located at 1144 Isabelle St, Memphis, TN 38122 and is currently estimated at $85,777, approximately $101 per square foot. 1144 Isabelle St is a home located in Shelby County with nearby schools including Kingsbury Elementary School, Kingsbury Middle School, and Kingsbury High School.
Ownership History
We collect this data history from publicly available records. To have your information removed, we recommend requesting removal directly through your county’s website.
Purchase Details
Home Financials for this Owner
Home Financials are based on the most recent Mortgage that was taken out on this home.Purchase Details
Purchase Details
Purchase Details
Purchase Details
Home Financials for this Owner
Home Financials are based on the most recent Mortgage that was taken out on this home.Home Values in the Area
Average Home Value in this Area
Purchase History
We collect this data history from publicly available records. To have your information removed, we recommend requesting removal directly through your county’s website.
| Date | Buyer | Sale Price | Title Company |
|---|---|---|---|
| $23,500 | Attorney | ||
| $4,000 | None Available | ||
| $28,000 | None Available | ||
| $4,000 | None Available | ||
| $39,000 | -- |
Mortgage History
We collect this data history from publicly available records. To have your information removed, we recommend requesting removal directly through your county’s website.
| Date | Status | Borrower | Loan Amount |
|---|---|---|---|
| Open | $18,800 | ||
| Previous Owner | $31,000 |
Tax History
We collect this data history from publicly available records. To have your information removed, we recommend requesting removal directly through your county’s website.
| Year | Tax Paid | Tax Assessment Tax Assessment Total Assessment is a certain percentage of the fair market value that is determined by local assessors to be the total taxable value of land and additions on the property. | Land | Improvement |
|---|---|---|---|---|
| 2025 | $484 | $18,000 | $3,750 | $14,250 |
| 2024 | $306 | $9,025 | $1,475 | $7,550 |
| 2023 | $550 | $9,025 | $1,475 | $7,550 |
| 2022 | $550 | $9,025 | $1,475 | $7,550 |
| 2021 | $556 | $9,025 | $1,475 | $7,550 |
| 2020 | $487 | $6,725 | $1,275 | $5,450 |
| 2019 | $487 | $6,725 | $1,275 | $5,450 |
| 2018 | $487 | $6,725 | $1,275 | $5,450 |
| 2017 | $276 | $6,725 | $1,275 | $5,450 |
| 2016 | $295 | $6,750 | $0 | $0 |
| 2014 | $295 | $6,750 | $0 | $0 |
Map
- 3753 Rockwood Ave
- 1185 Wrenwood St
- 3723 Wayne Ave
- 3789 Fairoaks Ave
- 1024 Wrenwood St
- 3755 Fairmont Ave
- 960 Dillworth St
- 958 Isabelle St
- 1231 Victor Dr
- 973 Maria St
- 967 Maria St
- 1150 Biltmore St
- 3981 Grahamdale Cir Unit 3981B
- 3965 Canterbury Dr
- 3983 Grahamdale Cir Unit 3983A
- 3989 Grahamdale Cir Unit 3989A
- 3967 Grahamdale Cir Unit 3967B
- 1096 Gordon St
- 1345 Maria St
- 3640 Fairmont Ave
- 1138 Isabelle St
- 1150 Isabelle St
- 3788 Macon Rd
- 1154 Isabelle St
- 3794 Macon Rd
- 3764 Macon Rd
- 1149 Salem St
- 1149 Isabelle St
- 1155 Salem St
- 3800 Macon Rd
- 1160 Isabelle St
- 3756 Macon Rd
- 3781 Macon Rd
- 3755 Buchanan Ave
- 3791 Macon Rd
- 1163 Salem St
- 3775 Macon Rd
- 3795 Macon Rd
- 3768 Buchanan Ave
- 3767 Macon Rd
Ask me questions while you tour the home.