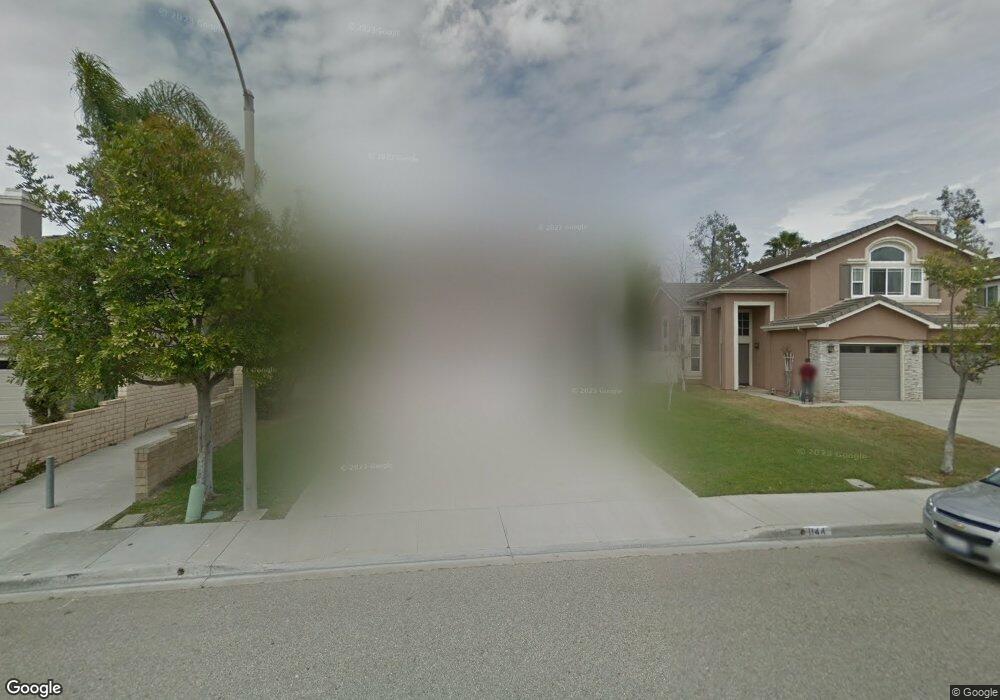
1144 Via Carranza Camarillo, CA 93012
Estimated Value: $1,132,000 - $1,303,000
5
Beds
4
Baths
3,094
Sq Ft
$396/Sq Ft
Est. Value
About This Home
This home is located at 1144 Via Carranza, Camarillo, CA 93012 and is currently estimated at $1,225,501, approximately $396 per square foot. 1144 Via Carranza is a home located in Ventura County with nearby schools including Tierra Linda Elementary School, Las Colinas Middle School, and Adolfo Camarillo High School.
Ownership History
Date
Name
Owned For
Owner Type
Purchase Details
Closed on
Mar 30, 2004
Sold by
Ford Debbie
Bought by
Ford Deborah Lynn and Deborah Ford Trust
Current Estimated Value
Purchase Details
Closed on
Mar 6, 2002
Sold by
Ford Deborah L and Ford Debbie
Bought by
Ford Deborah L
Home Financials for this Owner
Home Financials are based on the most recent Mortgage that was taken out on this home.
Original Mortgage
$219,000
Outstanding Balance
$86,252
Interest Rate
6.25%
Estimated Equity
$1,139,249
Purchase Details
Closed on
Nov 18, 1999
Sold by
Ford Keith
Bought by
Ford Debbie
Purchase Details
Closed on
Dec 19, 1995
Sold by
Pardee Construction Company
Bought by
Ford Keith and Ford Debbie
Home Financials for this Owner
Home Financials are based on the most recent Mortgage that was taken out on this home.
Original Mortgage
$265,462
Interest Rate
6.75%
Create a Home Valuation Report for This Property
The Home Valuation Report is an in-depth analysis detailing your home's value as well as a comparison with similar homes in the area
Home Values in the Area
Average Home Value in this Area
Purchase History
| Date | Buyer | Sale Price | Title Company |
|---|---|---|---|
| Ford Deborah Lynn | -- | -- | |
| Ford Deborah L | -- | Stewart Title Company | |
| Ford Debbie | -- | -- | |
| Ford Keith | $332,000 | Chicago Title Co |
Source: Public Records
Mortgage History
| Date | Status | Borrower | Loan Amount |
|---|---|---|---|
| Open | Ford Deborah L | $219,000 | |
| Closed | Ford Keith | $265,462 |
Source: Public Records
Tax History Compared to Growth
Tax History
| Year | Tax Paid | Tax Assessment Tax Assessment Total Assessment is a certain percentage of the fair market value that is determined by local assessors to be the total taxable value of land and additions on the property. | Land | Improvement |
|---|---|---|---|---|
| 2025 | $6,074 | $557,868 | $220,485 | $337,383 |
| 2024 | $6,074 | $546,930 | $216,162 | $330,768 |
| 2023 | $5,855 | $536,206 | $211,923 | $324,283 |
| 2022 | $5,836 | $525,693 | $207,768 | $317,925 |
| 2021 | $5,626 | $515,386 | $203,694 | $311,692 |
| 2020 | $5,605 | $510,103 | $201,606 | $308,497 |
| 2019 | $5,578 | $500,102 | $197,653 | $302,449 |
| 2018 | $5,475 | $490,297 | $193,778 | $296,519 |
| 2017 | $5,152 | $480,684 | $189,979 | $290,705 |
| 2016 | $5,028 | $471,259 | $186,254 | $285,005 |
| 2015 | $4,974 | $464,182 | $183,457 | $280,725 |
| 2014 | $4,858 | $455,091 | $179,864 | $275,227 |
Source: Public Records
Map
Nearby Homes
- 5247 San Francesca Dr
- 5302 Paseo Ricoso
- 1253 Mission Verde Dr Unit 1142
- 1404 Calle Lozano
- 860 Laurel Park Cir
- 1216 Mission Verde Dr
- 676 Buenos Tiempos Dr
- 5463 Quailridge Dr
- 5004 Ladera Vista Dr
- 5662 Willow View Dr
- 5684 Recodo Way
- 5696 Recodo Way
- 5118 Village 5
- 2854 Via Descanso
- 2860 Via Descanso
- 7202 Village 7 Unit 7
- 1631 Alta Vista Place
- 11225 Village 11
- 18 Tahquitz Ct Unit 217
- 135 Tranquila Dr Unit 61
- 1136 Via Carranza
- 1134 Via Carranza
- 1160 Via Carranza
- 1168 Via Carranza
- 1143 Via Carranza
- 1151 Via Carranza
- 1135 Via Carranza
- 1159 Via Carranza
- 1176 Via Carranza
- 5241 Mission Oaks Blvd
- 1127 Via Carranza
- 5255 Corte Estima
- 1112 Via Carranza
- 1167 Via Carranza
- 5195 Corte Estima
- 1119 Via Carranza
- 1184 Via Carranza
- 5219 Meadowview Dr
- 5215 Meadowview Dr
- 1175 Via Carranza