E
Landlord's Agent in 2018
Emily Williams
Dropped Members
Estimated Value: $373,333 - $401,000
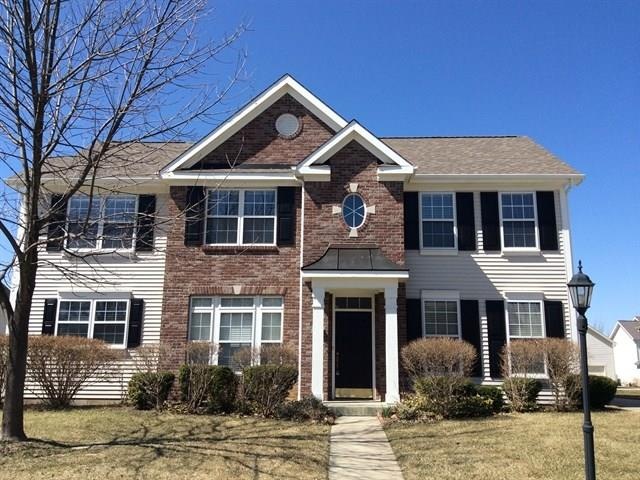
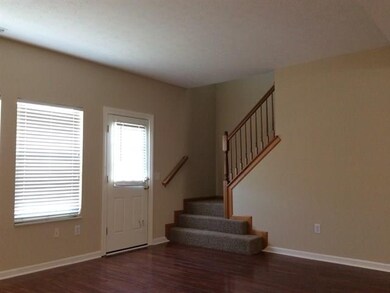
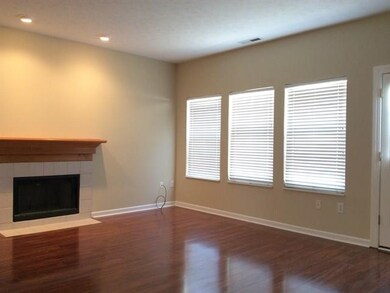
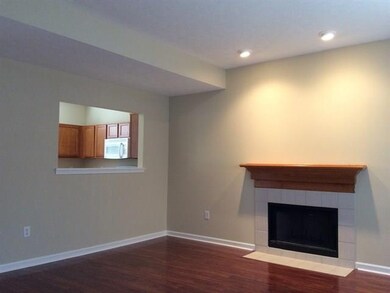
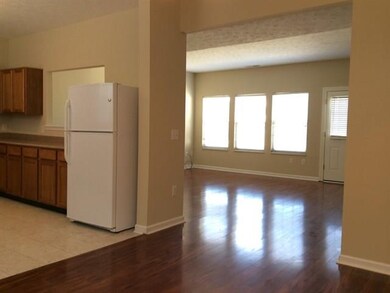
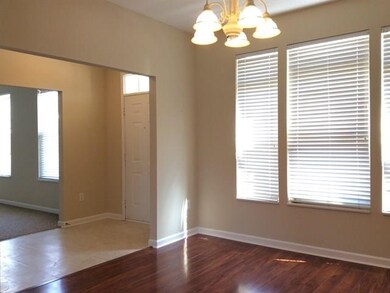
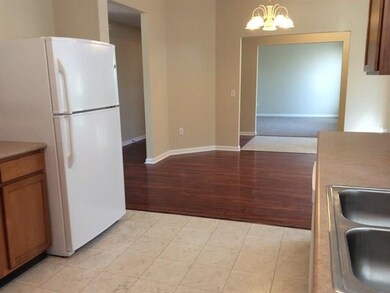
Move in ready home in great location and amazing neighborhood! Loaded with features that will make you smile!! Make this home your dream home! Security deposit is equal to one and a half month rent.
Last Agent to Rent the Property
Emily Williams
Dropped Members License #RB14051863 Listed on: 12/12/2018

Last Renter's Agent
Emily Williams
Dropped Members License #RB14051863 Listed on: 12/12/2018
| Date | Buyer | Sale Price | Title Company |
|---|---|---|---|
| American Homes 4 Rent Properties Ten Llc | -- | None Available | |
| Khan Mokbul A | -- | -- | |
| Khan Mokbul A | -- | -- |
| Date | Status | Borrower | Loan Amount |
|---|---|---|---|
| Previous Owner | Khan Mokbul A | $152,550 |
| Date | Event | Price | List to Sale | Price per Sq Ft | Prior Sale |
|---|---|---|---|---|---|
| 12/28/2018 12/28/18 | Rented | $1,595 | -5.9% | -- | |
| 12/25/2018 12/25/18 | Under Contract | -- | -- | -- | |
| 12/11/2018 12/11/18 | For Rent | $1,695 | +2.7% | -- | |
| 10/31/2016 10/31/16 | Rented | $1,650 | 0.0% | -- | |
| 10/21/2016 10/21/16 | Price Changed | $1,650 | -2.7% | $1 / Sq Ft | |
| 10/08/2016 10/08/16 | Price Changed | $1,695 | -5.6% | $1 / Sq Ft | |
| 09/09/2016 09/09/16 | Price Changed | $1,795 | -3.0% | $1 / Sq Ft | |
| 08/22/2016 08/22/16 | For Rent | $1,850 | +9.1% | -- | |
| 06/04/2015 06/04/15 | Rented | $1,695 | -8.4% | -- | |
| 06/04/2015 06/04/15 | Under Contract | -- | -- | -- | |
| 12/11/2014 12/11/14 | For Rent | $1,850 | +1.4% | -- | |
| 05/02/2014 05/02/14 | Rented | $1,825 | 0.0% | -- | |
| 04/16/2014 04/16/14 | Under Contract | -- | -- | -- | |
| 04/01/2014 04/01/14 | For Rent | $1,825 | 0.0% | -- | |
| 12/31/2013 12/31/13 | Sold | $198,000 | -1.0% | $78 / Sq Ft | View Prior Sale |
| 11/25/2013 11/25/13 | Pending | -- | -- | -- | |
| 11/05/2013 11/05/13 | Price Changed | $200,000 | -2.4% | $79 / Sq Ft | |
| 10/24/2013 10/24/13 | For Sale | $205,000 | -- | $81 / Sq Ft |
| Year | Tax Paid | Tax Assessment Tax Assessment Total Assessment is a certain percentage of the fair market value that is determined by local assessors to be the total taxable value of land and additions on the property. | Land | Improvement |
|---|---|---|---|---|
| 2024 | $6,052 | $288,500 | $47,300 | $241,200 |
| 2023 | $6,052 | $279,300 | $47,300 | $232,000 |
| 2022 | $5,355 | $241,100 | $47,300 | $193,800 |
| 2021 | $4,811 | $211,100 | $47,300 | $163,800 |
| 2020 | $4,648 | $202,700 | $47,300 | $155,400 |
| 2019 | $4,324 | $187,700 | $39,900 | $147,800 |
| 2018 | $4,404 | $191,100 | $39,900 | $151,200 |
| 2017 | $4,215 | $199,400 | $39,900 | $159,500 |
| 2016 | $4,437 | $195,900 | $39,900 | $156,000 |
| 2014 | $3,809 | $178,500 | $39,900 | $138,600 |
| 2013 | $3,809 | $174,200 | $39,900 | $134,300 |
E
Landlord's Agent in 2018
Emily Williams
Dropped Members
A
Seller's Agent in 2016
Amy Woodhams
Progress Residential Property
K
Buyer's Agent in 2015
Kimsley Farrar
CENTURY 21 Scheetz
E
Seller's Agent in 2014
Eden South
TBM Management
C
Buyer's Agent in 2014
Connie Hill
CENTURY 21 Scheetz
Seller's Agent in 2013
Julianne Deely
Berkshire Hathaway Home
(317) 414-6172
26 in this area
83 Total Sales
Source: MIBOR Broker Listing Cooperative®
MLS Number: MBR21610808
APN: 29-15-02-011-018.000-020
Disclaimer: Certain information contained herein is derived from information provided by parties other than Homes.com. All information provided is deemed reliable, but is not guaranteed to be accurate and should be independently verified.
![]() Based on information submitted to the MLS GRID. All data is obtained from various sources and may not have been verified by broker or MLS GRID. Supplied Open House Information is subject to change without notice. All information should be independently reviewed and verified for accuracy. Properties may or may not be listed by the office/agent presenting the information. Some IDX listings have been excluded from this website.
Based on information submitted to the MLS GRID. All data is obtained from various sources and may not have been verified by broker or MLS GRID. Supplied Open House Information is subject to change without notice. All information should be independently reviewed and verified for accuracy. Properties may or may not be listed by the office/agent presenting the information. Some IDX listings have been excluded from this website.