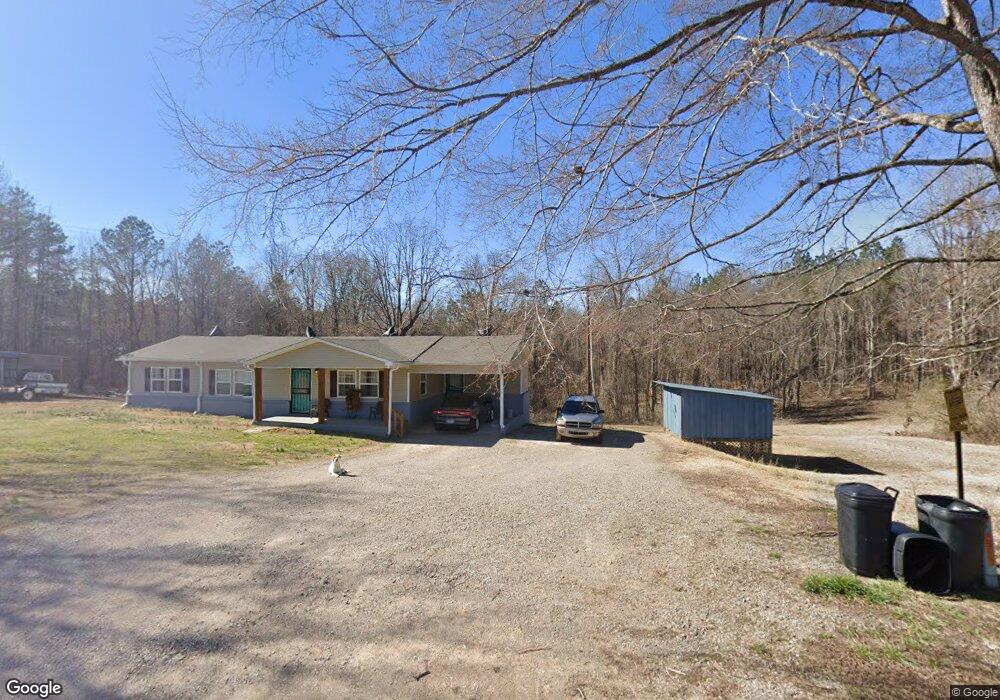
1145 Cypress Rd Pocahontas, TN 38061
Estimated Value: $148,265 - $172,000
2
Beds
2
Baths
1,250
Sq Ft
$127/Sq Ft
Est. Value
About This Home
This home is located at 1145 Cypress Rd, Pocahontas, TN 38061 and is currently estimated at $158,566, approximately $126 per square foot. 1145 Cypress Rd is a home located in McNairy County with nearby schools including Ramer Elementary School, Michie Elementary School, and Selmer Elementary School.
Ownership History
Date
Name
Owned For
Owner Type
Purchase Details
Closed on
Jul 24, 2025
Sold by
Knight Allen Lee
Bought by
Wilson Daniel A and Wilson Crystal
Current Estimated Value
Home Financials for this Owner
Home Financials are based on the most recent Mortgage that was taken out on this home.
Original Mortgage
$6,000
Outstanding Balance
$5,631
Interest Rate
6.84%
Mortgage Type
FHA
Estimated Equity
$152,935
Purchase Details
Closed on
Mar 15, 2012
Sold by
Homesales Inc
Bought by
Knight Allen Lee
Purchase Details
Closed on
Sep 9, 2011
Sold by
Wade Shelia
Bought by
Homesales Inc
Purchase Details
Closed on
Jul 15, 2008
Sold by
Carla Hall
Bought by
Nathanael Wade
Purchase Details
Closed on
Apr 8, 1994
Bought by
Leatherwood William and Leatherwood Sharon Cagle
Create a Home Valuation Report for This Property
The Home Valuation Report is an in-depth analysis detailing your home's value as well as a comparison with similar homes in the area
Home Values in the Area
Average Home Value in this Area
Purchase History
| Date | Buyer | Sale Price | Title Company |
|---|---|---|---|
| Wilson Daniel A | $159,000 | None Listed On Document | |
| Wilson Daniel A | $159,000 | None Listed On Document | |
| Knight Allen Lee | $38,500 | -- | |
| Homesales Inc | $38,250 | -- | |
| Nathanael Wade | $66,000 | -- | |
| Leatherwood William | $23,000 | -- |
Source: Public Records
Mortgage History
| Date | Status | Borrower | Loan Amount |
|---|---|---|---|
| Open | Wilson Daniel A | $6,000 | |
| Closed | Wilson Daniel A | $6,000 | |
| Open | Wilson Daniel A | $156,120 | |
| Closed | Wilson Daniel A | $156,120 |
Source: Public Records
Tax History Compared to Growth
Tax History
| Year | Tax Paid | Tax Assessment Tax Assessment Total Assessment is a certain percentage of the fair market value that is determined by local assessors to be the total taxable value of land and additions on the property. | Land | Improvement |
|---|---|---|---|---|
| 2025 | $349 | $22,150 | $0 | $0 |
| 2024 | $349 | $22,150 | $1,000 | $21,150 |
| 2023 | $349 | $22,150 | $1,000 | $21,150 |
| 2022 | $349 | $22,150 | $1,000 | $21,150 |
| 2021 | $338 | $16,525 | $1,250 | $15,275 |
| 2020 | $338 | $16,525 | $1,250 | $15,275 |
| 2019 | $338 | $16,525 | $1,250 | $15,275 |
| 2018 | $338 | $16,525 | $1,250 | $15,275 |
| 2017 | $338 | $16,525 | $1,250 | $15,275 |
| 2016 | $332 | $16,525 | $1,250 | $15,275 |
| 2015 | $345 | $16,525 | $1,250 | $15,275 |
| 2014 | -- | $16,900 | $1,375 | $15,525 |
Source: Public Records
Map
Nearby Homes
- 7225 Highway 57 W
- 00 Dan Head Rd
- 0 Butler Chapel Rd
- 0 Capooth Rd
- 160 Chewalla Rd
- 203 Wenasoga Rd
- 7000 Wolf Pen Rd
- 4083 Tennessee 57
- 4083 Highway 57 W
- 183 Matlock Rd
- 0 Essary Springs Rd
- 2380 Dunaway Rd
- 367 Eldie Foster Rd
- 9 Sulphur Springs Rd
- 3 Sulphur Springs Rd
- 0 Wolf Pen Rd
- 822 Chandler Ln
- 3285 Tennessee 57
- 4496 Vernie Kirk Rd
- 214 Arthur Byrd Rd
- 1050 Cypress Rd
- 711 Cypress Rd
- 55 Pitts Cove
- 224 Pitts Cove
- 0 Cypress Tank Rd Unit RTC2477532
- 8254 Highway 57 W
- 8466 Highway 57 W
- 8251 Highway 57 W
- 8176 Highway 57 W
- 8577 Highway 57 W
- 8531 Highway 57 W Unit 1
- 8531 Highway 57 W
- 8575 Highway 57 W
- 8635 Highway 57 W
- 8130 Highway 57 W
- 8732 Highway 57 W
- 8054 Highway 57 W
- 8145 Highway 57 W
- 8101 Highway 57 W
- 210 Cypress Rd