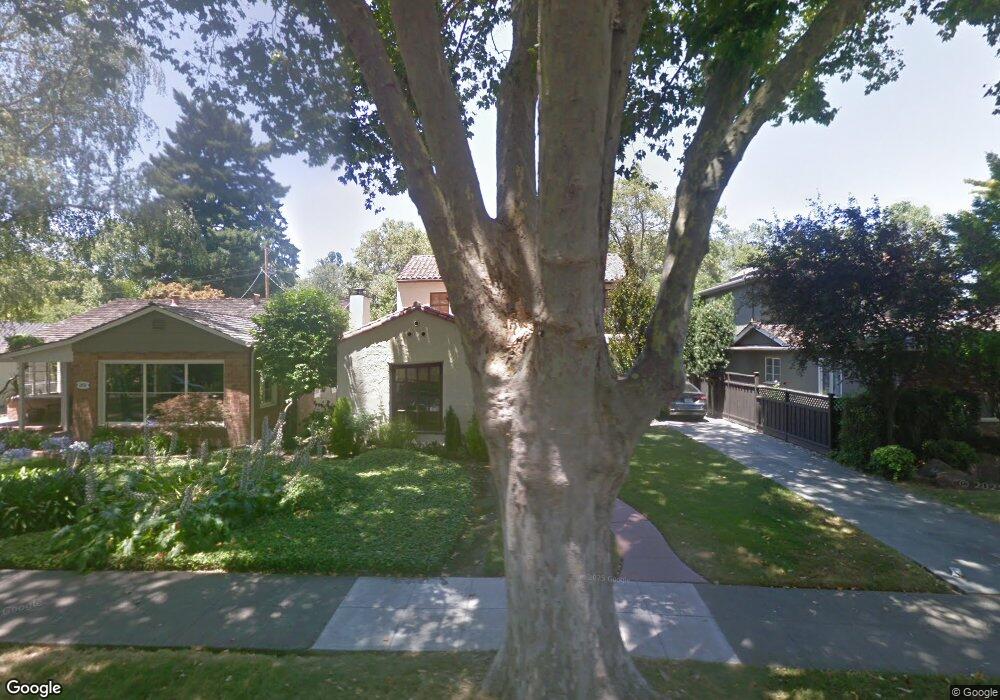
1145 Lennon Way San Jose, CA 95125
Willow Glen NeighborhoodEstimated Value: $2,214,000 - $2,484,000
3
Beds
3
Baths
2,145
Sq Ft
$1,117/Sq Ft
Est. Value
About This Home
This home is located at 1145 Lennon Way, San Jose, CA 95125 and is currently estimated at $2,397,008, approximately $1,117 per square foot. 1145 Lennon Way is a home located in Santa Clara County with nearby schools including Booksin Elementary, Willow Glen Middle, and Willow Glen High School.
Ownership History
Date
Name
Owned For
Owner Type
Purchase Details
Closed on
Mar 14, 2023
Sold by
2005 Blazier Family Revocable Living Tru
Bought by
Hua Jonathan and Hua Melissa
Current Estimated Value
Home Financials for this Owner
Home Financials are based on the most recent Mortgage that was taken out on this home.
Original Mortgage
$1,576,000
Outstanding Balance
$1,526,433
Interest Rate
6.12%
Mortgage Type
New Conventional
Estimated Equity
$870,575
Purchase Details
Closed on
Jan 3, 2005
Sold by
Blazier Richard T and Blazier Kara L
Bought by
Blazier Richard T and Blazier Kara L
Purchase Details
Closed on
Jun 4, 2001
Sold by
Button Duane
Bought by
Blazier Richard and Blazier Kara
Home Financials for this Owner
Home Financials are based on the most recent Mortgage that was taken out on this home.
Original Mortgage
$475,000
Interest Rate
7.14%
Purchase Details
Closed on
Aug 18, 1999
Sold by
Woodside Steven M and Woodside Linda S
Bought by
Button Duane
Home Financials for this Owner
Home Financials are based on the most recent Mortgage that was taken out on this home.
Original Mortgage
$553,125
Interest Rate
7.37%
Create a Home Valuation Report for This Property
The Home Valuation Report is an in-depth analysis detailing your home's value as well as a comparison with similar homes in the area
Home Values in the Area
Average Home Value in this Area
Purchase History
| Date | Buyer | Sale Price | Title Company |
|---|---|---|---|
| Hua Jonathan | $1,970,000 | Fidelity National Title Compan | |
| Blazier Richard T | -- | -- | |
| Blazier Richard T | -- | -- | |
| Blazier Richard | $875,000 | North American Title Co | |
| Button Duane | $737,500 | Commonwealth Land Title Co |
Source: Public Records
Mortgage History
| Date | Status | Borrower | Loan Amount |
|---|---|---|---|
| Open | Hua Jonathan | $1,576,000 | |
| Previous Owner | Blazier Richard | $475,000 | |
| Previous Owner | Button Duane | $553,125 | |
| Closed | Blazier Richard | $200,000 |
Source: Public Records
Tax History Compared to Growth
Tax History
| Year | Tax Paid | Tax Assessment Tax Assessment Total Assessment is a certain percentage of the fair market value that is determined by local assessors to be the total taxable value of land and additions on the property. | Land | Improvement |
|---|---|---|---|---|
| 2025 | $25,291 | $2,049,587 | $1,742,149 | $307,438 |
| 2024 | $25,291 | $2,009,400 | $1,707,990 | $301,410 |
| 2023 | $16,743 | $1,267,275 | $887,097 | $380,178 |
| 2022 | $16,568 | $1,242,427 | $869,703 | $372,724 |
| 2021 | $16,215 | $1,218,066 | $852,650 | $365,416 |
| 2020 | $15,801 | $1,205,578 | $843,908 | $361,670 |
| 2019 | $15,442 | $1,181,940 | $827,361 | $354,579 |
| 2018 | $15,279 | $1,158,766 | $811,139 | $347,627 |
| 2017 | $15,154 | $1,136,046 | $795,235 | $340,811 |
| 2016 | $14,928 | $1,113,772 | $779,643 | $334,129 |
| 2015 | $14,840 | $1,097,044 | $767,933 | $329,111 |
| 2014 | $13,916 | $1,075,556 | $752,891 | $322,665 |
Source: Public Records
Map
Nearby Homes
- 1110 Norval Way
- 1176 Laurie Ave
- 1109 Lincoln Ct
- 1105 Lincoln Ct
- 1037 Hazelwood Ave
- 1124 Pine Ave
- 1920 Glen Una Ave
- 1247 Curtner Ave
- 1719 Glen Una Ave
- 1768 Harmil Way
- 2265 Mazzaglia Ave
- 1951 Jonathan Ave
- 1148 Willow Glen Way
- 2059 Jonathan Ave
- 1028 Pascoe Ave
- 1655 Everett Ave
- 965 Louise Ave
- 888 Pine Ave
- 1027 Shenandoah Dr
- 1548 Lincoln Ave
- 1151 Lennon Way
- 1139 Lennon Way
- 1157 Lennon Way
- 1133 Lennon Way
- 1146 Roycott Way
- 1152 Roycott Way
- 1140 Roycott Way
- 1127 Lennon Way
- 1158 Roycott Way
- 1134 Roycott Way
- 1163 Lennon Way
- 1146 Lennon Way
- 1164 Roycott Way
- 1140 Lennon Way
- 1152 Lennon Way
- 1128 Roycott Way
- 1121 Lennon Way
- 1134 Lennon Way
- 1154 Lennon Way
- 1170 Roycott Way