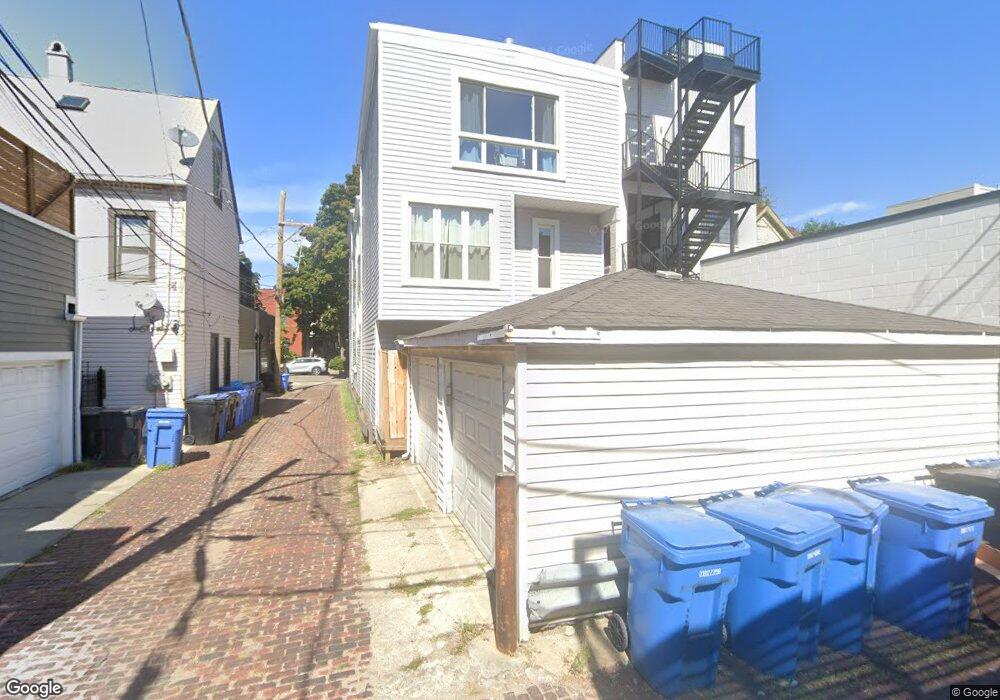
1145 W Altgeld St Unit A Chicago, IL 60614
Sheffield & DePaul NeighborhoodEstimated Value: $934,000 - $1,113,000
3
Beds
3
Baths
2,300
Sq Ft
$445/Sq Ft
Est. Value
About This Home
This home is located at 1145 W Altgeld St Unit A, Chicago, IL 60614 and is currently estimated at $1,022,953, approximately $444 per square foot. 1145 W Altgeld St Unit A is a home located in Cook County with nearby schools including Mayer Elementary School, Lincoln Park High School, and St Josaphat School.
Ownership History
Date
Name
Owned For
Owner Type
Purchase Details
Closed on
Feb 27, 2017
Sold by
Thorntor Dion
Bought by
Perkinson Phillip L and Wilson Brian J
Current Estimated Value
Home Financials for this Owner
Home Financials are based on the most recent Mortgage that was taken out on this home.
Original Mortgage
$508,000
Outstanding Balance
$422,194
Interest Rate
4.25%
Mortgage Type
New Conventional
Estimated Equity
$600,759
Purchase Details
Closed on
Jun 25, 2008
Sold by
Jones Thomas E and Jones Susan R
Bought by
Thornton Dion
Home Financials for this Owner
Home Financials are based on the most recent Mortgage that was taken out on this home.
Original Mortgage
$384,000
Interest Rate
6.39%
Mortgage Type
Unknown
Purchase Details
Closed on
Mar 2, 2001
Sold by
Kedar Moshe and Rom Kedar Vered
Bought by
Jones Thomas E and Jones Susan R
Home Financials for this Owner
Home Financials are based on the most recent Mortgage that was taken out on this home.
Original Mortgage
$336,000
Interest Rate
7.25%
Create a Home Valuation Report for This Property
The Home Valuation Report is an in-depth analysis detailing your home's value as well as a comparison with similar homes in the area
Home Values in the Area
Average Home Value in this Area
Purchase History
| Date | Buyer | Sale Price | Title Company |
|---|---|---|---|
| Perkinson Phillip L | $635,000 | Attorney | |
| Thornton Dion | $480,000 | Git | |
| Jones Thomas E | $420,000 | Chicago Title Insurance Co |
Source: Public Records
Mortgage History
| Date | Status | Borrower | Loan Amount |
|---|---|---|---|
| Open | Perkinson Phillip L | $508,000 | |
| Previous Owner | Thornton Dion | $384,000 | |
| Previous Owner | Jones Thomas E | $336,000 |
Source: Public Records
Tax History Compared to Growth
Tax History
| Year | Tax Paid | Tax Assessment Tax Assessment Total Assessment is a certain percentage of the fair market value that is determined by local assessors to be the total taxable value of land and additions on the property. | Land | Improvement |
|---|---|---|---|---|
| 2024 | $14,661 | $94,835 | $30,839 | $63,996 |
| 2023 | $14,270 | $72,800 | $24,870 | $47,930 |
| 2022 | $14,270 | $72,800 | $24,870 | $47,930 |
| 2021 | $13,970 | $72,800 | $24,870 | $47,930 |
| 2020 | $13,028 | $58,483 | $19,232 | $39,251 |
| 2019 | $12,772 | $63,569 | $19,232 | $44,337 |
| 2018 | $12,557 | $63,569 | $19,232 | $44,337 |
| 2017 | $7,900 | $40,075 | $17,243 | $22,832 |
| 2016 | $7,526 | $40,075 | $17,243 | $22,832 |
| 2015 | $6,863 | $40,075 | $17,243 | $22,832 |
| 2014 | $5,189 | $30,533 | $8,953 | $21,580 |
| 2013 | $5,314 | $30,533 | $8,953 | $21,580 |
Source: Public Records
Map
Nearby Homes
- 2446 N Racine Ave Unit 1F
- 1134 W Fullerton Ave Unit 1
- 2541 N Racine Ave Unit 2
- 2459 N Seminary Ave Unit 2S
- 1219 W Wrightwood Ave
- 1014 W Montana St
- 2617 N Seminary Ave Unit 3S
- 1313 W Wrightwood Ave Unit 3
- 2654 N Lincoln Ave
- 1350 W Fullerton Ave Unit 405
- 953 W Montana St Unit 1
- 1359 W Fullerton Ave Unit PH
- 1142 W Schubert Ave Unit 3
- 1344 W Wrightwood Ave Unit 1
- 2730 N Lincoln Ave Unit 2
- 2222 N Racine Ave Unit 12
- 943 W Montana St Unit 3
- 917 W Altgeld St Unit 1
- 2418 N Southport Ave Unit 1
- 2227 N Magnolia Ave
- 1145 W Altgeld St Unit B
- 1145 W Altgeld St Unit B
- 1143 W Altgeld St
- 1143 W Altgeld St Unit 2
- 1143 W Altgeld St Unit 1
- 1139 W Altgeld St
- 2453 N Racine Ave
- 2453 N Racine Ave
- 2453 N Racine Ave Unit CH2
- 2447 N Racine Ave
- 2459 N Racine Ave
- 2449 N Racine Ave Unit 1
- 2449 N Racine Ave Unit 2
- 2449 N Racine Ave Unit 3
- 2449 N Racine Ave
- 2455 N Racine Ave
- 2455 N Racine Ave Unit 1
- 2455 N Racine Ave Unit 3
- 1133 W Altgeld St
- 1140 W Montana St Unit A