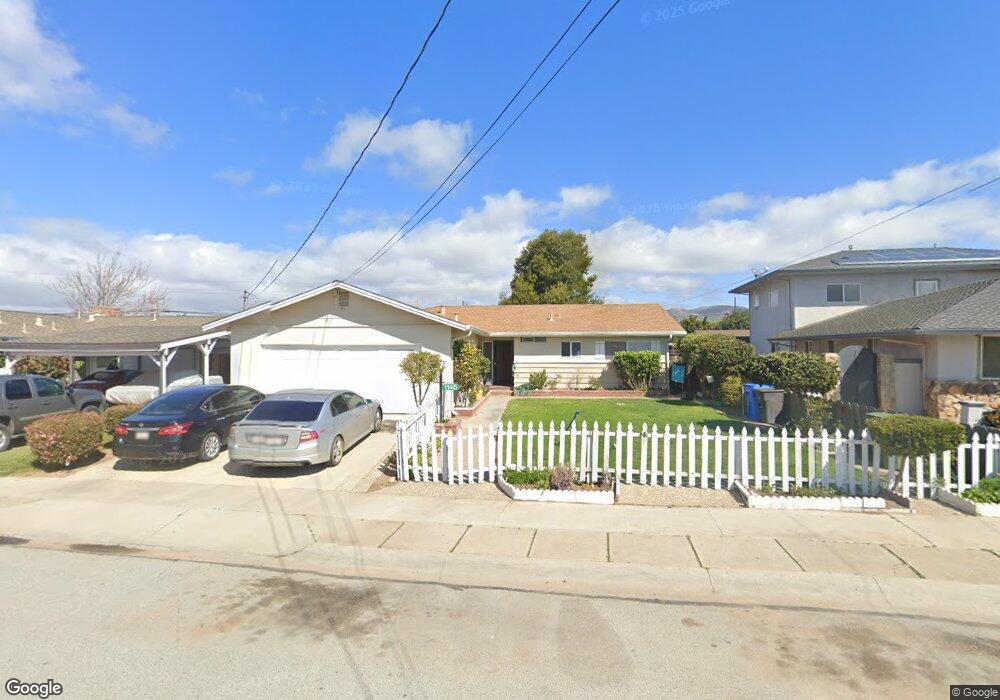
1145 Walker Dr Soledad, CA 93960
Estimated Value: $525,000 - $594,000
3
Beds
2
Baths
1,372
Sq Ft
$416/Sq Ft
Est. Value
About This Home
This home is located at 1145 Walker Dr, Soledad, CA 93960 and is currently estimated at $570,148, approximately $415 per square foot. 1145 Walker Dr is a home located in Monterey County with nearby schools including Gabilan Elementary School, Main Street Middle School, and Soledad High School.
Ownership History
Date
Name
Owned For
Owner Type
Purchase Details
Closed on
Jan 7, 2026
Sold by
Hernandez Maribel
Bought by
Hernandez Maribel
Current Estimated Value
Home Financials for this Owner
Home Financials are based on the most recent Mortgage that was taken out on this home.
Original Mortgage
$60,000
Outstanding Balance
$60,000
Interest Rate
6.19%
Mortgage Type
Credit Line Revolving
Estimated Equity
$510,148
Purchase Details
Closed on
Jul 7, 2020
Sold by
Perez Elvin
Bought by
Hernandez Maribel
Home Financials for this Owner
Home Financials are based on the most recent Mortgage that was taken out on this home.
Original Mortgage
$140,000
Interest Rate
3.1%
Mortgage Type
New Conventional
Purchase Details
Closed on
Mar 17, 2010
Sold by
Morales Hortencia and The Meza Trust
Bought by
Hernandez Maribel
Home Financials for this Owner
Home Financials are based on the most recent Mortgage that was taken out on this home.
Original Mortgage
$149,246
Interest Rate
5.25%
Mortgage Type
FHA
Purchase Details
Closed on
Apr 19, 1996
Sold by
Meza Frank and Meza Rosa
Bought by
Meza Frank M and Meza Rosa
Create a Home Valuation Report for This Property
The Home Valuation Report is an in-depth analysis detailing your home's value as well as a comparison with similar homes in the area
Home Values in the Area
Average Home Value in this Area
Purchase History
| Date | Buyer | Sale Price | Title Company |
|---|---|---|---|
| Hernandez Maribel | -- | First American Title | |
| Hernandez Maribel | -- | Old Republic Title Company | |
| Hernandez Maribel | -- | Old Republic Title Company | |
| Hernandez Maribel | $152,000 | Old Republic Title Company | |
| Meza Frank M | -- | -- |
Source: Public Records
Mortgage History
| Date | Status | Borrower | Loan Amount |
|---|---|---|---|
| Open | Hernandez Maribel | $60,000 | |
| Previous Owner | Hernandez Maribel | $140,000 | |
| Previous Owner | Hernandez Maribel | $149,246 |
Source: Public Records
Tax History
| Year | Tax Paid | Tax Assessment Tax Assessment Total Assessment is a certain percentage of the fair market value that is determined by local assessors to be the total taxable value of land and additions on the property. | Land | Improvement |
|---|---|---|---|---|
| 2025 | $2,403 | $196,187 | $77,441 | $118,746 |
| 2024 | $2,403 | $192,341 | $75,923 | $116,418 |
| 2023 | $2,177 | $188,571 | $74,435 | $114,136 |
| 2022 | $2,206 | $184,875 | $72,976 | $111,899 |
| 2021 | $2,132 | $181,251 | $71,546 | $109,705 |
| 2020 | $2,097 | $179,394 | $70,813 | $108,581 |
| 2019 | $2,049 | $175,877 | $69,425 | $106,452 |
| 2018 | $2,077 | $172,429 | $68,064 | $104,365 |
| 2017 | $2,003 | $169,049 | $66,730 | $102,319 |
| 2016 | $1,913 | $165,735 | $65,422 | $100,313 |
| 2015 | $1,885 | $163,247 | $64,440 | $98,807 |
| 2014 | $1,875 | $160,050 | $63,178 | $96,872 |
Source: Public Records
Map
Nearby Homes
- 1117 Palm Ave
- 35095 Metz Rd
- 615 Monterey St
- 570 Tankersley St
- 665 Molera Ave
- 965 Las Flores St
- 449 Sage Ct
- 836 Vasquez Dr
- 604 Gardenia Place
- 1253 La Paz Ct
- 1231 Carmelo
- 715 Skinner St
- 31102 Camphora Gloria Rd
- 33900 Fabry Rd
- 31021 Camphora Rd
- 35700 Eagle Ridge
- 36527 Metz Rd
- 31462 El Camino Real
- 35422 Paraiso Springs Rd
- 41460 Los Coches Rd
Your Personal Tour Guide
Ask me questions while you tour the home.