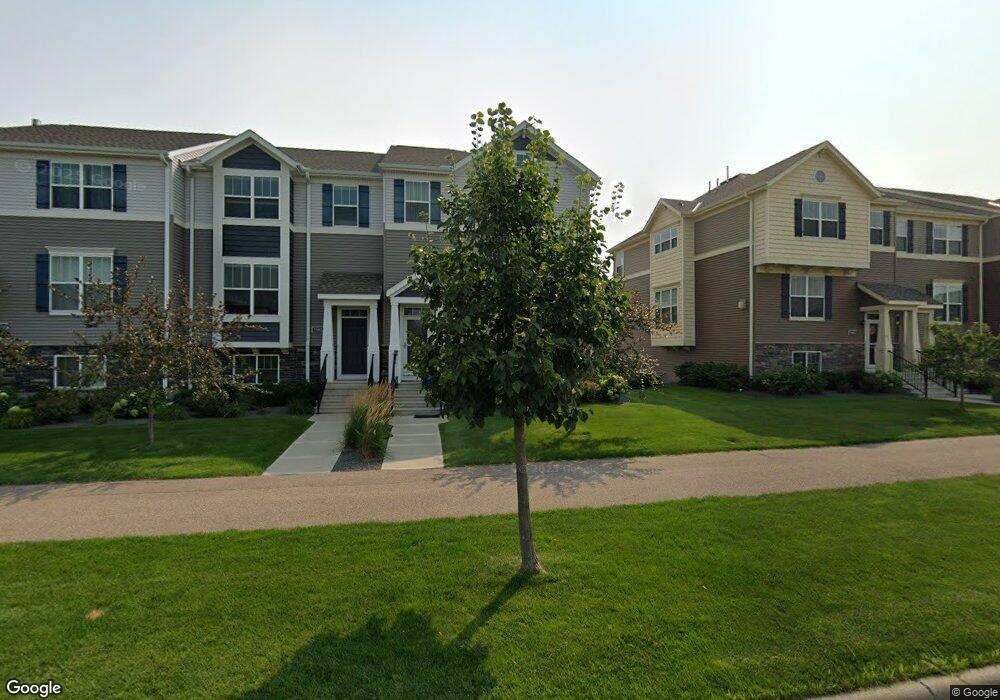
11457 82nd Ave N Maple Grove, MN 55369
Estimated Value: $411,261 - $472,000
3
Beds
3
Baths
2,422
Sq Ft
$181/Sq Ft
Est. Value
About This Home
This home is located at 11457 82nd Ave N, Maple Grove, MN 55369 and is currently estimated at $439,565, approximately $181 per square foot. 11457 82nd Ave N is a home located in Hennepin County with nearby schools including Rice Lake Elementary School, Maple Grove Middle School, and Osseo Senior High School.
Ownership History
Date
Name
Owned For
Owner Type
Purchase Details
Closed on
Oct 29, 2020
Sold by
Kathrein Charles J and Kathrein Ann M
Bought by
Kathrein Charles J and Kathrein Ann M
Current Estimated Value
Purchase Details
Closed on
Sep 5, 2019
Sold by
Roggenbuck Daniel V
Bought by
Kathrein Charles J
Home Financials for this Owner
Home Financials are based on the most recent Mortgage that was taken out on this home.
Original Mortgage
$357,525
Outstanding Balance
$313,164
Interest Rate
3.6%
Mortgage Type
VA
Estimated Equity
$126,401
Purchase Details
Closed on
Oct 11, 2018
Sold by
Roggenbuck Daniel V and Roggenbuck Sandra C
Bought by
Roggenbuck Daniel V and Roggenbuck Sandra C
Purchase Details
Closed on
Aug 30, 2017
Sold by
Calatlantic Group Inc
Bought by
Roggenbuck Daniel V and Roggenbuck Sandra C
Home Financials for this Owner
Home Financials are based on the most recent Mortgage that was taken out on this home.
Original Mortgage
$100,000
Interest Rate
3.96%
Mortgage Type
New Conventional
Create a Home Valuation Report for This Property
The Home Valuation Report is an in-depth analysis detailing your home's value as well as a comparison with similar homes in the area
Home Values in the Area
Average Home Value in this Area
Purchase History
| Date | Buyer | Sale Price | Title Company |
|---|---|---|---|
| Kathrein Charles J | -- | None Available | |
| Kathrein Charles J | $350,000 | Burnet Title | |
| Roggenbuck Daniel V | -- | None Available | |
| Roggenbuck Daniel V | $345,897 | Calatlantic Title Inc |
Source: Public Records
Mortgage History
| Date | Status | Borrower | Loan Amount |
|---|---|---|---|
| Open | Kathrein Charles J | $357,525 | |
| Previous Owner | Roggenbuck Daniel V | $100,000 |
Source: Public Records
Tax History Compared to Growth
Tax History
| Year | Tax Paid | Tax Assessment Tax Assessment Total Assessment is a certain percentage of the fair market value that is determined by local assessors to be the total taxable value of land and additions on the property. | Land | Improvement |
|---|---|---|---|---|
| 2024 | $5,047 | $420,700 | $116,500 | $304,200 |
| 2023 | $4,866 | $414,400 | $99,200 | $315,200 |
| 2022 | $4,246 | $428,000 | $100,600 | $327,400 |
| 2021 | $4,134 | $353,600 | $77,400 | $276,200 |
| 2020 | $4,124 | $338,400 | $75,000 | $263,400 |
| 2019 | $4,209 | $323,800 | $80,000 | $243,800 |
| 2018 | $276 | $312,900 | $90,000 | $222,900 |
| 2017 | $111 | $6,300 | $6,300 | $0 |
Source: Public Records
Map
Nearby Homes
- 11462 81st Place N
- 11540 81st Place N
- 11601 82nd Ave N
- 8154 Arrowwood Ln N
- 8406 Jonquil Ln N
- 11879 85th Place N Unit 54
- 8704 Cottonwood Ln N
- 11537 88th Ave N
- 11631 88th Ave N
- 12598 84th Place N
- 8405 Norwood Ln N
- 12775 82nd Place N
- 8326 Oakview Ct N
- 11760 88th Place N
- 14877 106th Ave N
- 12509 88th Ave N
- 9058 Goldenrod Ln N
- 9132 Kirkwood Ln N
- 12585 74th Ave N
- 12688 74th Ave N Unit 36
- 11463 82nd Ave N
- 11433 82nd Ave N
- 11475 82nd Ave N
- 11421 82nd Ave N
- 11483 82nd Ave N
- 11409 82nd Ave N
- 11409 82nd Place N
- 11491 82nd Ave N
- 8199 Central Park Way N
- 11474 81st Place N
- 8199 Central Park Way
- 11503 82nd Ave N
- 11486 81st Place N
- 8193 Central Park Way
- 8187 Central Park Way
- 11515 82nd Ave N
- 8183 Central Park Way
- 11514 81st Place N
- 11523 82nd Ave N
- 8177 Central Park Way