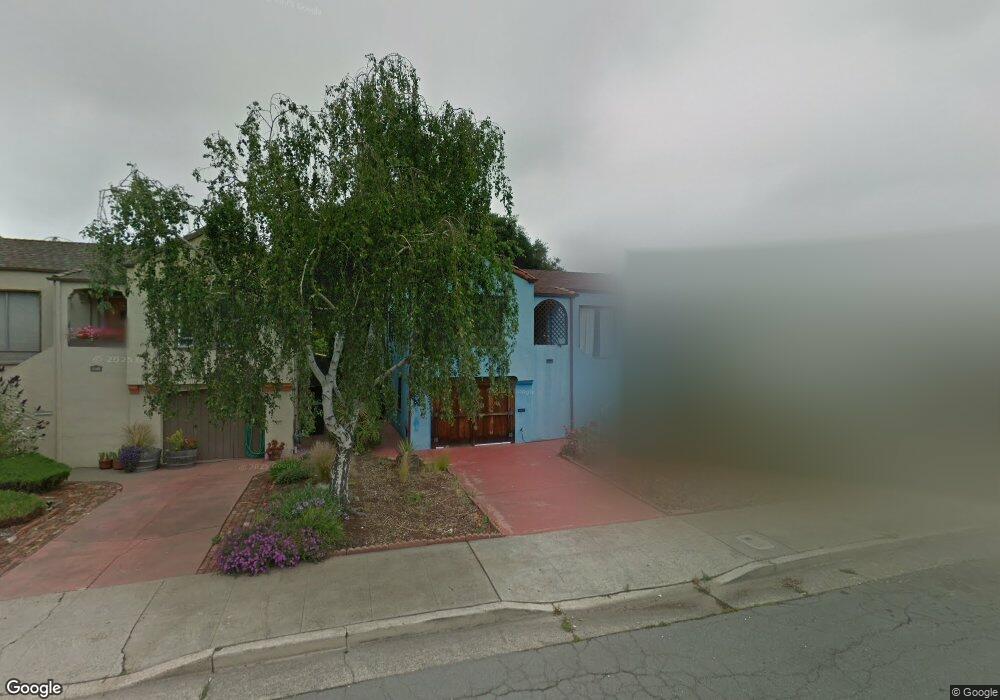
1146 Ohio St Vallejo, CA 94590
West Vallejo NeighborhoodEstimated Value: $440,000 - $487,000
2
Beds
1
Bath
893
Sq Ft
$510/Sq Ft
Est. Value
About This Home
This home is located at 1146 Ohio St, Vallejo, CA 94590 and is currently estimated at $455,595, approximately $510 per square foot. 1146 Ohio St is a home located in Solano County with nearby schools including Highland Elementary, Vallejo High School, and Caliber: ChangeMakers Academy.
Ownership History
Date
Name
Owned For
Owner Type
Purchase Details
Closed on
Oct 30, 2017
Sold by
Gary Circle Llc
Bought by
Ssfrp Iii Llc
Current Estimated Value
Home Financials for this Owner
Home Financials are based on the most recent Mortgage that was taken out on this home.
Original Mortgage
$201,619
Outstanding Balance
$168,858
Interest Rate
3.83%
Mortgage Type
Commercial
Estimated Equity
$286,737
Purchase Details
Closed on
Nov 6, 2012
Sold by
Federal National Mortgage Association
Bought by
Gary Circle Llc
Purchase Details
Closed on
Aug 17, 2012
Sold by
Fox Garold B and Fox Beth Elaine
Bought by
Federal National Mortgage Association
Create a Home Valuation Report for This Property
The Home Valuation Report is an in-depth analysis detailing your home's value as well as a comparison with similar homes in the area
Home Values in the Area
Average Home Value in this Area
Purchase History
| Date | Buyer | Sale Price | Title Company |
|---|---|---|---|
| Ssfrp Iii Llc | $252,500 | Placer Title Co | |
| Gary Circle Llc | $92,000 | Stewart Title | |
| Federal National Mortgage Association | $68,300 | Landsafe Title |
Source: Public Records
Mortgage History
| Date | Status | Borrower | Loan Amount |
|---|---|---|---|
| Open | Ssfrp Iii Llc | $201,619 |
Source: Public Records
Tax History Compared to Growth
Tax History
| Year | Tax Paid | Tax Assessment Tax Assessment Total Assessment is a certain percentage of the fair market value that is determined by local assessors to be the total taxable value of land and additions on the property. | Land | Improvement |
|---|---|---|---|---|
| 2025 | $5,361 | $381,167 | $73,956 | $307,211 |
| 2024 | $5,361 | $373,694 | $72,506 | $301,188 |
| 2023 | $5,069 | $366,368 | $71,085 | $295,283 |
| 2022 | $4,983 | $359,186 | $69,692 | $289,494 |
| 2021 | $5,371 | $352,144 | $68,326 | $283,818 |
| 2020 | $5,065 | $348,534 | $67,626 | $280,908 |
| 2019 | $4,765 | $341,700 | $66,300 | $275,400 |
| 2018 | $4,723 | $335,000 | $65,000 | $270,000 |
| 2017 | $1,707 | $97,614 | $21,220 | $76,394 |
| 2016 | $1,136 | $95,701 | $20,804 | $74,897 |
| 2015 | $1,122 | $94,264 | $20,492 | $73,772 |
| 2014 | $1,107 | $92,418 | $20,091 | $72,327 |
Source: Public Records
Map
Nearby Homes