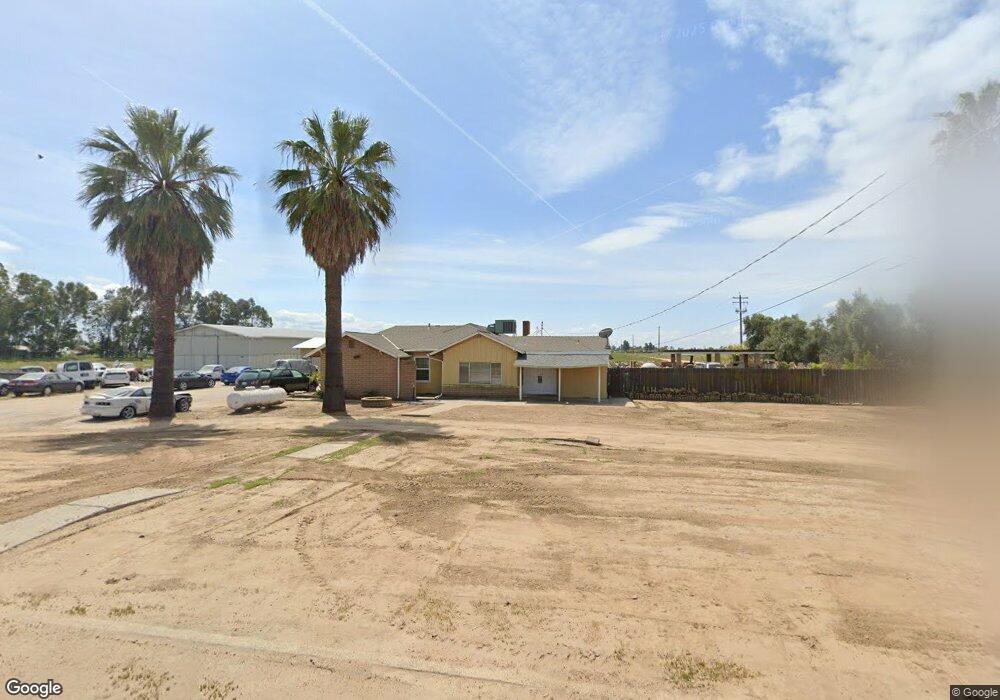
11467 E Shields Ave Sanger, CA 93657
Estimated Value: $527,000 - $584,779
5
Beds
2
Baths
1,671
Sq Ft
$336/Sq Ft
Est. Value
About This Home
This home is located at 11467 E Shields Ave, Sanger, CA 93657 and is currently estimated at $561,260, approximately $335 per square foot. 11467 E Shields Ave is a home located in Fresno County with nearby schools including Fairmont Elementary School, Washington Academic Middle School, and Sanger High School.
Ownership History
Date
Name
Owned For
Owner Type
Purchase Details
Closed on
Feb 14, 2011
Sold by
Deutsche Bank National Trust Company
Bought by
Siriphoosit Somsri and Rattanatay Vath
Current Estimated Value
Purchase Details
Closed on
Sep 15, 2010
Sold by
Vang Kao and Moua Bao
Bought by
Deutsche Bank National Trust Company
Purchase Details
Closed on
Jul 21, 2004
Sold by
Db Investors Llc
Bought by
Kevorkian Steven and Kevorkian Lily
Home Financials for this Owner
Home Financials are based on the most recent Mortgage that was taken out on this home.
Original Mortgage
$224,000
Interest Rate
4.08%
Mortgage Type
Negative Amortization
Purchase Details
Closed on
Jul 9, 2004
Sold by
Kevorkian Steven and Kevorkian Lily
Bought by
Vang Kao and Moua Bao
Home Financials for this Owner
Home Financials are based on the most recent Mortgage that was taken out on this home.
Original Mortgage
$224,000
Interest Rate
4.08%
Mortgage Type
Negative Amortization
Purchase Details
Closed on
Sep 16, 2002
Sold by
Db Investors Llc
Bought by
Db Investors Llc
Purchase Details
Closed on
Feb 20, 1998
Sold by
Inez Sanchez Jose
Bought by
Db Investors Llc
Create a Home Valuation Report for This Property
The Home Valuation Report is an in-depth analysis detailing your home's value as well as a comparison with similar homes in the area
Purchase History
| Date | Buyer | Sale Price | Title Company |
|---|---|---|---|
| Siriphoosit Somsri | $125,000 | Servicelink | |
| Deutsche Bank National Trust Company | $197,100 | Accommodation | |
| Kevorkian Steven | $125,000 | Chicago Title Co | |
| Vang Kao | $280,000 | Chicago Title Co | |
| Db Investors Llc | -- | -- | |
| Db Investors Llc | $75,000 | Fidelity National Title |
Source: Public Records
Mortgage History
| Date | Status | Borrower | Loan Amount |
|---|---|---|---|
| Previous Owner | Vang Kao | $224,000 |
Source: Public Records
Tax History
| Year | Tax Paid | Tax Assessment Tax Assessment Total Assessment is a certain percentage of the fair market value that is determined by local assessors to be the total taxable value of land and additions on the property. | Land | Improvement |
|---|---|---|---|---|
| 2025 | $2,592 | $196,913 | $115,302 | $81,611 |
| 2023 | $2,400 | $189,269 | $110,826 | $78,443 |
| 2022 | $2,302 | $185,558 | $108,653 | $76,905 |
| 2021 | $2,280 | $181,921 | $106,523 | $75,398 |
| 2020 | $2,212 | $180,056 | $105,431 | $74,625 |
| 2019 | $2,165 | $176,526 | $103,364 | $73,162 |
| 2018 | $2,074 | $173,066 | $101,338 | $71,728 |
| 2017 | $2,036 | $169,673 | $99,351 | $70,322 |
| 2016 | $1,905 | $166,347 | $97,403 | $68,944 |
| 2015 | $1,919 | $163,849 | $95,940 | $67,909 |
| 2014 | $1,893 | $160,640 | $94,061 | $66,579 |
Source: Public Records
Map
Nearby Homes
- 2630 N Del Rey Ave
- 2421 N Bethel Ave
- 3520 N Bethel Ave
- 2383 N Greenwood Ave
- 2524 N Mccall Ave
- 12740 E Robinson Ave
- 4199 N Quail Crossing
- 4133 N Morro Bay
- 4249 N Waterside Dr
- 10952 E Promontory Way
- 4626 N Arrow Ridge Way
- 4674 N Arrow Ridge Way
- 11078 Sawtooth Peak Way
- 4769 N Emerald Peak Dr
- 3215 Lourdes Ave
- 4588 N Mccall Ave
- 10588 E Fieldstone Ave
- 4520 Griffith Ave
- 12000 E Shaw Ave
- 505 E Indianola Ave
- 11459 E Shields Ave
- 3022 N Indianola Ave
- 3017 N Indianola Ave
- 11424 E Shields Ave
- 3054 N Indianola Ave
- 3069 N Indianola Ave
- 3086 N Indianola Ave
- 3027 N Isabella Ave
- 11346 E Shields Ave
- 3071 N Isabella Ave
- 11331 E Shields Ave
- 3120 N Indianola Ave
- 3079 N Indianola Ave
- 0 E Shields Ave
- 11328 E Shields Ave
- 3113 N Isabella Ave
- 3221 N Indianola Ave
- 3026 N Isabella Ave
- 3154 N Indianola Ave
- 11696 E Shields Ave
Your Personal Tour Guide
Ask me questions while you tour the home.