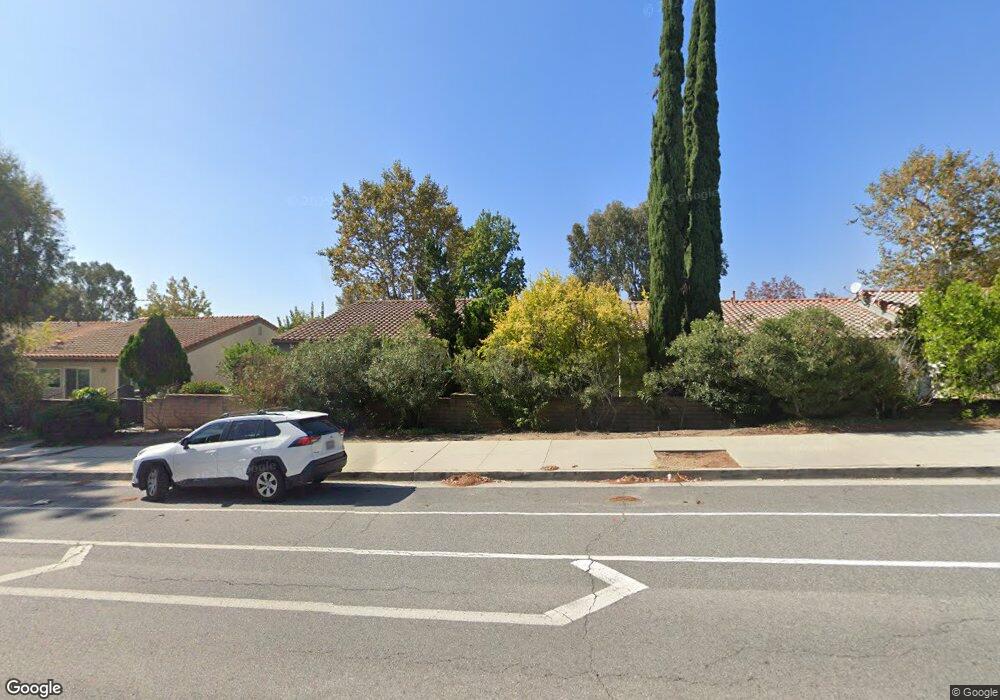
11467 Tampa Ave Unit 156 Porter Ranch, CA 91326
Porter Ranch NeighborhoodEstimated Value: $717,000 - $762,000
4
Beds
3
Baths
1,637
Sq Ft
$453/Sq Ft
Est. Value
About This Home
This home is located at 11467 Tampa Ave Unit 156, Porter Ranch, CA 91326 and is currently estimated at $741,418, approximately $452 per square foot. 11467 Tampa Ave Unit 156 is a home located in Los Angeles County with nearby schools including Robert Frost Middle School, Northridge Academy High, and Valley Academy of Arts & Sciences.
Ownership History
Date
Name
Owned For
Owner Type
Purchase Details
Closed on
Dec 12, 2001
Sold by
Lofquist Maureen D
Bought by
Morikawa Mark Rikio and Morikawa Ewa
Current Estimated Value
Home Financials for this Owner
Home Financials are based on the most recent Mortgage that was taken out on this home.
Original Mortgage
$225,600
Outstanding Balance
$89,919
Interest Rate
6.84%
Estimated Equity
$651,499
Purchase Details
Closed on
Aug 1, 2001
Sold by
Pearson Dr Merri C
Bought by
Lofquist Maureen D
Purchase Details
Closed on
May 31, 2000
Sold by
Carothers C Diane and The Diane Mcneil Trust
Bought by
Pearson Dr Merri C
Home Financials for this Owner
Home Financials are based on the most recent Mortgage that was taken out on this home.
Original Mortgage
$190,000
Interest Rate
8.55%
Purchase Details
Closed on
Jul 28, 1999
Sold by
Carothers C Diane
Bought by
Carothers C Diane and Diane Mcneil Trust
Create a Home Valuation Report for This Property
The Home Valuation Report is an in-depth analysis detailing your home's value as well as a comparison with similar homes in the area
Home Values in the Area
Average Home Value in this Area
Purchase History
| Date | Buyer | Sale Price | Title Company |
|---|---|---|---|
| Morikawa Mark Rikio | $282,000 | Equity Title Company | |
| Lofquist Maureen D | $243,500 | Equity Title | |
| Pearson Dr Merri C | $240,000 | Fidelity National Title | |
| Carothers C Diane | -- | -- |
Source: Public Records
Mortgage History
| Date | Status | Borrower | Loan Amount |
|---|---|---|---|
| Open | Morikawa Mark Rikio | $225,600 | |
| Previous Owner | Pearson Dr Merri C | $190,000 |
Source: Public Records
Tax History Compared to Growth
Tax History
| Year | Tax Paid | Tax Assessment Tax Assessment Total Assessment is a certain percentage of the fair market value that is determined by local assessors to be the total taxable value of land and additions on the property. | Land | Improvement |
|---|---|---|---|---|
| 2025 | $5,216 | $416,572 | $82,714 | $333,858 |
| 2024 | $5,216 | $408,405 | $81,093 | $327,312 |
| 2023 | $5,119 | $400,398 | $79,503 | $320,895 |
| 2022 | $4,885 | $392,548 | $77,945 | $314,603 |
| 2021 | $4,821 | $384,852 | $76,417 | $308,435 |
| 2019 | $4,680 | $373,439 | $74,151 | $299,288 |
| 2018 | $4,604 | $366,118 | $72,698 | $293,420 |
| 2016 | $4,391 | $351,903 | $69,876 | $282,027 |
| 2015 | $4,329 | $346,618 | $68,827 | $277,791 |
| 2014 | $4,349 | $339,829 | $67,479 | $272,350 |
Source: Public Records
Map
Nearby Homes
- 11427 Tampa Ave Unit 76
- 11471 Tampa Ave Unit 149
- 11311 Tampa Ave Unit 30
- 19519 Rinaldi St Unit 57
- 0 Yolanda Chatsworth Unit OC25225712
- 11773 N Greenwood
- 11648 Mariposa Bay Ln
- 19628 Pine Valley Ave
- 20378 W Marlow Ln
- 20268 W Albion Way
- 20809 W Acorn Cir
- 19573 Pine Valley Ave
- 11657 Porter Valley Dr
- 11801 Thunderbird Ave
- 11717 Pala Mesa Dr
- 19259 Ludlow St
- 19140 Lahey St Unit 4
- 19153 Lahey St Unit 1
- 20120 Jubilee Way
- 11759 Coorsgold Ln
- 11415 Tampa Ave
- 11435 Tampa Ave Unit 93
- 11411 Tampa Ave Unit 121
- 11445 Tampa Ave Unit 135
- 11439 Tampa Ave Unit 101
- 11443 Tampa Ave Unit 107
- 11443 Tampa Ave Unit 105
- 11401 Tampa Ave Unit 111
- 11467 Tampa Ave Unit 155
- 11443 Tampa Ave Unit 103
- 11415 Tampa Ave Unit 125
- 11439 Tampa Ave Unit 97
- 11443 Tampa Ave Unit 104
- 11439 Tampa Ave Unit 99
- 11431 Tampa Ave Unit 87
- 11415 Tampa Ave Unit 124
- 11435 Tampa Ave Unit 91
- 11435 Tampa Ave Unit 90
- 11415 Tampa Ave Unit 123
- 11439 Tampa Ave Unit 100