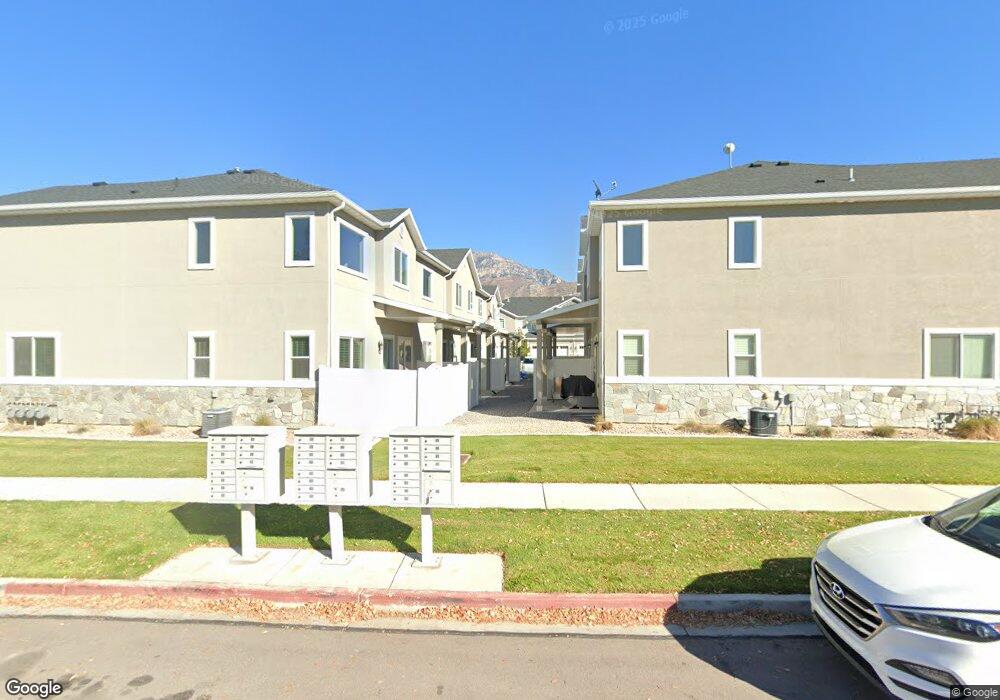
1147 S 225 E Orem, UT 84058
Westmore NeighborhoodEstimated Value: $444,811 - $550,000
3
Beds
3
Baths
2,294
Sq Ft
$217/Sq Ft
Est. Value
About This Home
This home is located at 1147 S 225 E, Orem, UT 84058 and is currently estimated at $497,270, approximately $216 per square foot. 1147 S 225 E is a home located in Utah County with nearby schools including Westmore Elementary School, Lakeridge Jr High School, and Mountain View High School.
Ownership History
Date
Name
Owned For
Owner Type
Purchase Details
Closed on
Sep 20, 2019
Sold by
Thomson Chantell
Bought by
Johnson David
Current Estimated Value
Home Financials for this Owner
Home Financials are based on the most recent Mortgage that was taken out on this home.
Original Mortgage
$269,680
Outstanding Balance
$236,219
Interest Rate
3.6%
Mortgage Type
New Conventional
Estimated Equity
$261,051
Purchase Details
Closed on
Feb 17, 2017
Sold by
Orchard Heights Townhomes Llc
Bought by
Thomson Chantell
Create a Home Valuation Report for This Property
The Home Valuation Report is an in-depth analysis detailing your home's value as well as a comparison with similar homes in the area
Home Values in the Area
Average Home Value in this Area
Purchase History
| Date | Buyer | Sale Price | Title Company |
|---|---|---|---|
| Johnson David | -- | Utah First Title Ins Agency | |
| Thomson Chantell | -- | Cottonwood Title Ins Ag | |
| Orchard Heights Townhomes Llc | -- | Cottonwood Title Ins Ag |
Source: Public Records
Mortgage History
| Date | Status | Borrower | Loan Amount |
|---|---|---|---|
| Open | Johnson David | $269,680 |
Source: Public Records
Tax History
| Year | Tax Paid | Tax Assessment Tax Assessment Total Assessment is a certain percentage of the fair market value that is determined by local assessors to be the total taxable value of land and additions on the property. | Land | Improvement |
|---|---|---|---|---|
| 2025 | $1,972 | $244,420 | -- | -- |
| 2024 | $1,972 | $241,175 | $0 | $0 |
| 2023 | $1,781 | $234,080 | $0 | $0 |
| 2022 | $1,822 | $232,045 | $0 | $0 |
| 2021 | $1,645 | $317,200 | $47,600 | $269,600 |
| 2020 | $1,580 | $299,400 | $44,900 | $254,500 |
| 2019 | $1,518 | $299,100 | $44,900 | $254,200 |
| 2018 | $855 | $161,000 | $35,000 | $126,000 |
| 2017 | $878 | $88,550 | $0 | $0 |
Source: Public Records
Map
Nearby Homes
Your Personal Tour Guide
Ask me questions while you tour the home.