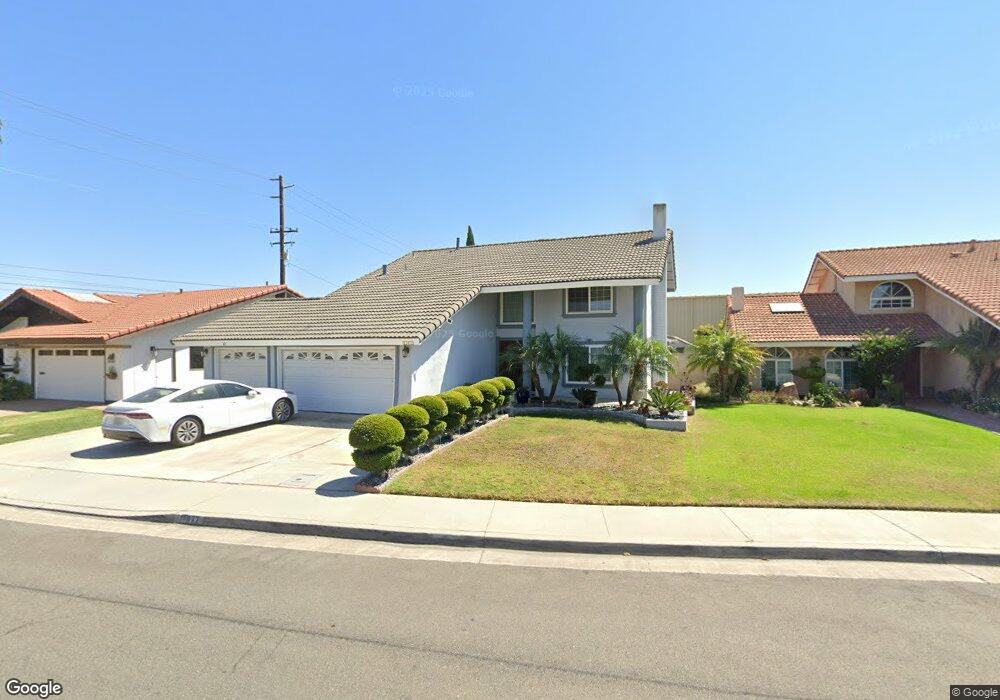
11472 Coriender Ave Fountain Valley, CA 92708
Estimated Value: $1,375,000 - $1,574,000
4
Beds
4
Baths
2,535
Sq Ft
$592/Sq Ft
Est. Value
About This Home
This home is located at 11472 Coriender Ave, Fountain Valley, CA 92708 and is currently estimated at $1,500,357, approximately $591 per square foot. 11472 Coriender Ave is a home located in Orange County with nearby schools including Mamie L. Northcutt Elementary School, Fitz Intermediate Language Academy, and Los Amigos High School.
Ownership History
Date
Name
Owned For
Owner Type
Purchase Details
Closed on
Aug 5, 2025
Sold by
My Thi Caos Revocable Living Trust and Nguyen Quang Huynh
Bought by
Nguyen Anthony Joseph and Nguyen Brenda Mary
Current Estimated Value
Purchase Details
Closed on
May 4, 2016
Sold by
Nguyen Quang Huynh and Cao My Thi
Bought by
Nguyen Quang Huynh and Revocab Thi Caos Revocab
Purchase Details
Closed on
Feb 10, 1997
Sold by
Lam Nguyen Danny and Thi Phai Thi
Bought by
Nguyen Quang Huynh and Cao My Thi
Purchase Details
Closed on
Sep 14, 1995
Sold by
Hu Liang Tung and Hu Chen Kung Hsiu
Bought by
Nguyen Danny Lam and Nguyen Phai Thi
Home Financials for this Owner
Home Financials are based on the most recent Mortgage that was taken out on this home.
Original Mortgage
$150,000
Interest Rate
7.88%
Create a Home Valuation Report for This Property
The Home Valuation Report is an in-depth analysis detailing your home's value as well as a comparison with similar homes in the area
Home Values in the Area
Average Home Value in this Area
Purchase History
| Date | Buyer | Sale Price | Title Company |
|---|---|---|---|
| Nguyen Anthony Joseph | -- | None Listed On Document | |
| Nguyen Quang Huynh | -- | None Available | |
| Nguyen Quang Huynh | $236,000 | Landwood Title Company | |
| Nguyen Danny Lam | $227,500 | Orange Coast Title |
Source: Public Records
Mortgage History
| Date | Status | Borrower | Loan Amount |
|---|---|---|---|
| Previous Owner | Nguyen Danny Lam | $150,000 |
Source: Public Records
Tax History Compared to Growth
Tax History
| Year | Tax Paid | Tax Assessment Tax Assessment Total Assessment is a certain percentage of the fair market value that is determined by local assessors to be the total taxable value of land and additions on the property. | Land | Improvement |
|---|---|---|---|---|
| 2025 | $5,174 | $451,952 | $205,760 | $246,192 |
| 2024 | $5,174 | $443,091 | $201,726 | $241,365 |
| 2023 | $5,077 | $434,403 | $197,770 | $236,633 |
| 2022 | $4,966 | $425,886 | $193,892 | $231,994 |
| 2021 | $4,915 | $417,536 | $190,090 | $227,446 |
| 2020 | $4,847 | $413,255 | $188,141 | $225,114 |
| 2019 | $4,753 | $405,152 | $184,452 | $220,700 |
| 2018 | $4,657 | $397,208 | $180,835 | $216,373 |
| 2017 | $4,593 | $389,420 | $177,289 | $212,131 |
| 2016 | $4,392 | $381,785 | $173,813 | $207,972 |
| 2015 | $4,329 | $376,051 | $171,202 | $204,849 |
| 2014 | $4,222 | $368,685 | $167,848 | $200,837 |
Source: Public Records
Map
Nearby Homes
- 11872 Goodale Ave
- 17168 Newhope St Unit 222
- 16402 San Jacinto St
- 17200 Newhope St Unit 109
- 17200 Newhope St Unit 217
- 12143 Sylvan River Unit 147
- 17288 San Lorenzo Cir
- 12062 W Edinger Ave Unit 19
- 17077 Los Modelos St
- 17401 Hood Ct
- 3510 & 3512 W Pine St
- 15880 Bogart Ct
- 1080 S Harbor Blvd Unit 2
- 15890 Camo Bluff Ct
- 3318 W Borchard Cir
- 12300 W Lilac Ave Unit 220
- 12300 W Lilac Ave Unit 714
- 901 S Harmon St
- 10744 Lehnhardt Ave
- 10452 Circulo de Juarez
- 11484 Coriender Ave
- 11460 Coriender Ave Unit 125
- 11450 Coriender Ave
- 11465 Coriender Ave
- 11481 Coriender Ave
- 11438 Coriender Ave
- 16780 Tin Mountain Cir
- 16711 Mount Erin Cir
- 16692 Mount Erin Cir
- 16784 Tin Mountain Cir
- 11426 Coriender Ave
- 11513 Quartz Ave
- 16783 Tin Mountain Cir
- 16699 Mount Erin Cir
- 16680 Mount Erin Cir
- 11414 Coriender Ave
- 11525 Quartz Ave
- 16792 Tin Mountain Cir
- 16687 Mount Erin Cir
- 16712 Mount Allyson Cir