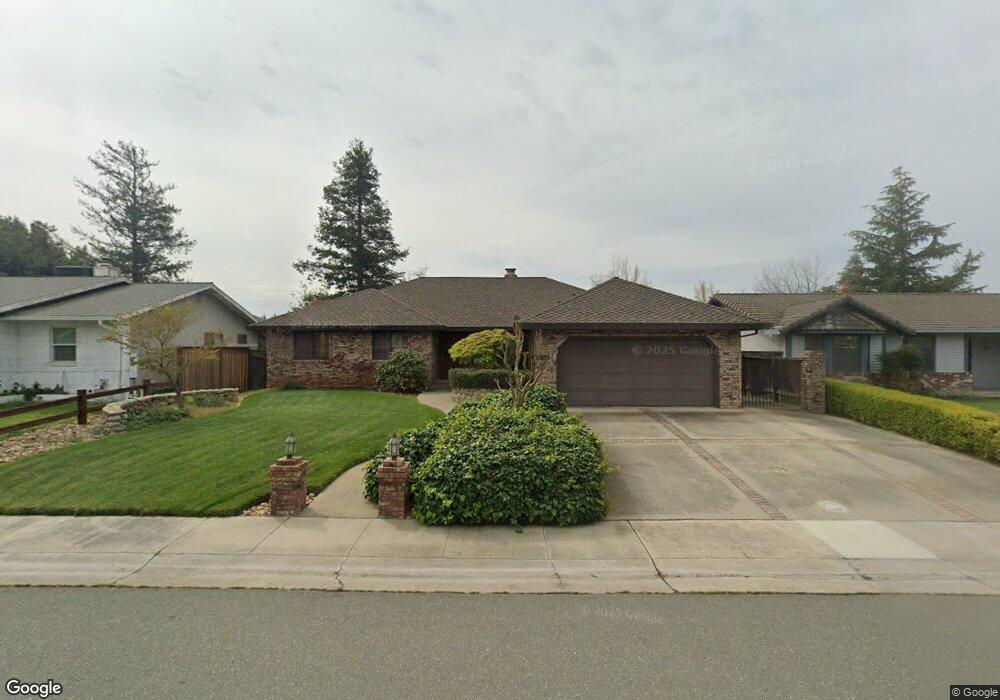
1148 4th Ave Walnut Grove, CA 95690
Estimated Value: $380,000 - $518,532
3
Beds
2
Baths
1,666
Sq Ft
$277/Sq Ft
Est. Value
About This Home
This home is located at 1148 4th Ave, Walnut Grove, CA 95690 and is currently estimated at $461,883, approximately $277 per square foot. 1148 4th Ave is a home located in Sacramento County with nearby schools including Walnut Grove Elementary School, Clarksburg Middle School, and Delta High School.
Ownership History
Date
Name
Owned For
Owner Type
Purchase Details
Closed on
Feb 23, 2022
Sold by
John Laurenzi
Bought by
Laurenzi John and Laurenzi Cynthia M
Current Estimated Value
Home Financials for this Owner
Home Financials are based on the most recent Mortgage that was taken out on this home.
Original Mortgage
$317,000
Outstanding Balance
$294,045
Interest Rate
3.92%
Mortgage Type
New Conventional
Estimated Equity
$167,838
Purchase Details
Closed on
Jun 21, 2018
Sold by
Laurenzi Cynthia M
Bought by
Laurenzi John L
Purchase Details
Closed on
Aug 15, 2016
Sold by
Laurenzi John
Bought by
Laurenzi John and Laurenzi Cynthia M
Home Financials for this Owner
Home Financials are based on the most recent Mortgage that was taken out on this home.
Original Mortgage
$294,057
Interest Rate
3.42%
Mortgage Type
FHA
Purchase Details
Closed on
Mar 12, 2014
Sold by
Laurenzi Cynthia
Bought by
Laurenzi John
Create a Home Valuation Report for This Property
The Home Valuation Report is an in-depth analysis detailing your home's value as well as a comparison with similar homes in the area
Purchase History
| Date | Buyer | Sale Price | Title Company |
|---|---|---|---|
| Laurenzi John | -- | Usa National Title | |
| Laurenzi John L | -- | None Available | |
| Laurenzi John | -- | Timios Inc | |
| Laurenzi John | -- | None Available |
Source: Public Records
Mortgage History
| Date | Status | Borrower | Loan Amount |
|---|---|---|---|
| Open | Laurenzi John | $317,000 | |
| Previous Owner | Laurenzi John | $294,057 |
Source: Public Records
Tax History
| Year | Tax Paid | Tax Assessment Tax Assessment Total Assessment is a certain percentage of the fair market value that is determined by local assessors to be the total taxable value of land and additions on the property. | Land | Improvement |
|---|---|---|---|---|
| 2025 | $3,225 | $298,526 | $99,184 | $199,342 |
| 2024 | $3,225 | $292,674 | $97,240 | $195,434 |
| 2023 | $3,137 | $286,936 | $95,334 | $191,602 |
| 2022 | $3,118 | $281,311 | $93,465 | $187,846 |
| 2021 | $6,381 | $275,796 | $91,633 | $184,163 |
| 2020 | $6,279 | $272,969 | $90,694 | $182,275 |
| 2019 | $2,716 | $267,617 | $88,916 | $178,701 |
| 2018 | $2,637 | $262,371 | $87,173 | $175,198 |
| 2017 | $2,763 | $257,227 | $85,464 | $171,763 |
| 2016 | $2,535 | $252,185 | $83,789 | $168,396 |
| 2015 | $2,574 | $248,398 | $82,531 | $165,867 |
| 2014 | $2,453 | $243,533 | $80,915 | $162,618 |
Source: Public Records
Map
Nearby Homes
- 1200 2nd Ave
- 14132 Market St
- 14144 Market St
- 14105 River Rd
- 14071 River Rd
- 1264 B St
- 14055 River Rd
- 14090 Winnie St
- 14120 Grove St
- 14117 Pine St
- 1332 Corodon St
- 13911 River Rd
- 14371 Race Track Rd
- 14226 California 160
- 13955 W Walnut Grove Rd Unit 26
- 14268 California 160
- 0 Halls Island Unit ML82032701
- 14286 State Hwy 160
- 0 Andrus Island Rd Unit 23383044
- 28725 N Vail Rd
Your Personal Tour Guide
Ask me questions while you tour the home.