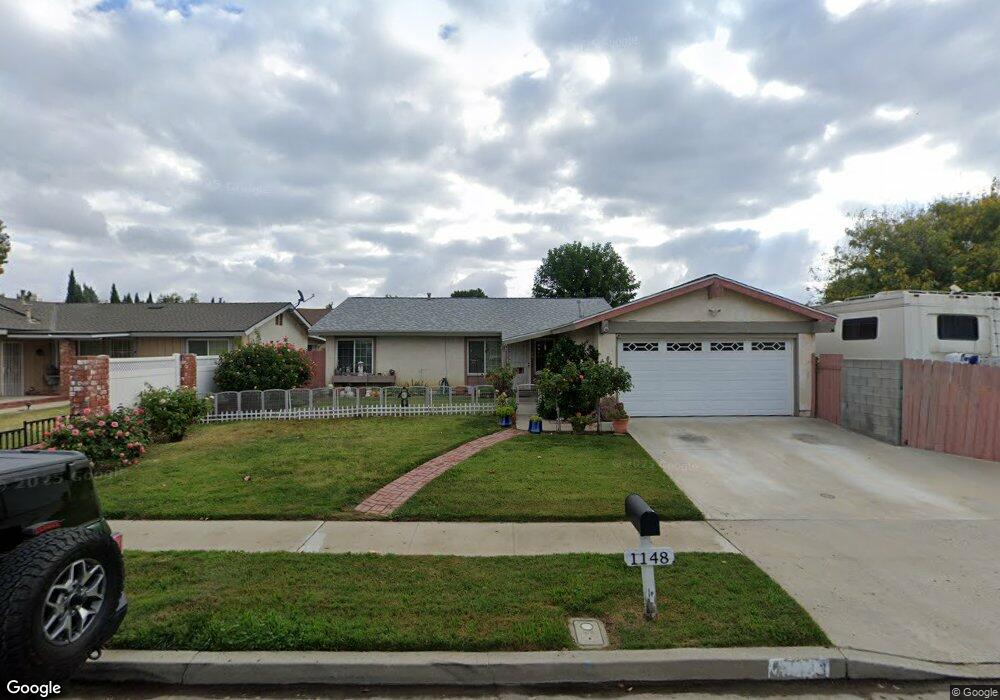
1148 Brandon Ave Simi Valley, CA 93065
Central Simi Valley NeighborhoodEstimated Value: $708,000 - $741,000
4
Beds
2
Baths
1,215
Sq Ft
$596/Sq Ft
Est. Value
About This Home
This home is located at 1148 Brandon Ave, Simi Valley, CA 93065 and is currently estimated at $724,189, approximately $596 per square foot. 1148 Brandon Ave is a home located in Ventura County with nearby schools including Crestview Elementary School, Hillside Middle School, and Royal High School.
Ownership History
Date
Name
Owned For
Owner Type
Purchase Details
Closed on
Apr 4, 2023
Sold by
Shapiro Martin J and Shapiro Sharon A
Bought by
Shapiro Sharon A
Current Estimated Value
Purchase Details
Closed on
Aug 28, 2002
Sold by
Shapiro Sharon A and Rondello Sharon A
Bought by
Shapiro Martin J and Shapiro Sharon A
Home Financials for this Owner
Home Financials are based on the most recent Mortgage that was taken out on this home.
Original Mortgage
$146,000
Interest Rate
6.29%
Purchase Details
Closed on
Oct 29, 1998
Sold by
Welch Sharon A and Welch Sharon A
Bought by
Rondello Sharon A
Home Financials for this Owner
Home Financials are based on the most recent Mortgage that was taken out on this home.
Original Mortgage
$80,000
Interest Rate
6.84%
Purchase Details
Closed on
Oct 30, 1997
Sold by
Rondello Anthony
Bought by
Welch Sharon A and Rondello Sharon A
Create a Home Valuation Report for This Property
The Home Valuation Report is an in-depth analysis detailing your home's value as well as a comparison with similar homes in the area
Home Values in the Area
Average Home Value in this Area
Purchase History
| Date | Buyer | Sale Price | Title Company |
|---|---|---|---|
| Shapiro Sharon A | -- | Lawyers Title Company | |
| Shapiro Martin J | -- | American Title Co | |
| Rondello Sharon A | -- | -- | |
| Welch Sharon A | -- | -- |
Source: Public Records
Mortgage History
| Date | Status | Borrower | Loan Amount |
|---|---|---|---|
| Previous Owner | Shapiro Martin J | $146,000 | |
| Previous Owner | Rondello Sharon A | $80,000 |
Source: Public Records
Tax History Compared to Growth
Tax History
| Year | Tax Paid | Tax Assessment Tax Assessment Total Assessment is a certain percentage of the fair market value that is determined by local assessors to be the total taxable value of land and additions on the property. | Land | Improvement |
|---|---|---|---|---|
| 2025 | $1,399 | $65,745 | $19,358 | $46,387 |
| 2024 | $1,399 | $64,456 | $18,978 | $45,478 |
| 2023 | $1,310 | $63,193 | $18,606 | $44,587 |
| 2022 | $1,264 | $61,954 | $18,241 | $43,713 |
| 2021 | $1,219 | $60,740 | $17,884 | $42,856 |
| 2020 | $1,169 | $60,118 | $17,701 | $42,417 |
| 2019 | $1,109 | $58,940 | $17,354 | $41,586 |
| 2018 | $1,075 | $57,785 | $17,014 | $40,771 |
| 2017 | $1,033 | $56,653 | $16,681 | $39,972 |
| 2016 | $977 | $55,543 | $16,354 | $39,189 |
| 2015 | $937 | $54,710 | $16,109 | $38,601 |
| 2014 | $901 | $53,641 | $15,795 | $37,846 |
Source: Public Records
Map
Nearby Homes
- 2490 Invar Ct
- 2141 Fitzgerald Rd
- 1036 Stanford Dr
- 2267 Morley St
- 2675 Lembert St
- 1135 Donner Ave
- 2025 Royal Ave
- 951 Vallejo Ave
- 1636 Earl Ave
- 1276 Roberta Ct
- 2339 Rudolph Dr
- 2783 Fallon Cir
- 2044 Covington Ave
- 1917 Fitzgerald Rd
- 2098 Covington Ave
- 1290 Lawrence Cir
- 1948 Heywood St Unit L
- 2858 Fitzgerald Rd
- 1904 Heywood St Unit L
- 1776 Kearney Ave
- 1166 Brandon Ave
- 2351 Torrance St
- 2339 Torrance St
- 2347 Torrance St
- 1147 Brandon Ave
- 2353 Torrance St
- 1137 Brandon Ave
- 1165 Brandon Ave
- 2346 Royal Ave Unit 5
- 2346 Royal Ave Unit 6
- 2346 Royal Ave Unit 9
- 2346 Royal Ave Unit 8
- 2346 Royal Ave Unit 7
- 2355 Torrance St
- 1123 Brandon Ave
- 1179 Brandon Ave
- 2383 Torrance St
- 2358 Royal Ave Unit 13
- 2358 Royal Ave Unit 12
- 2358 Royal Ave Unit 11