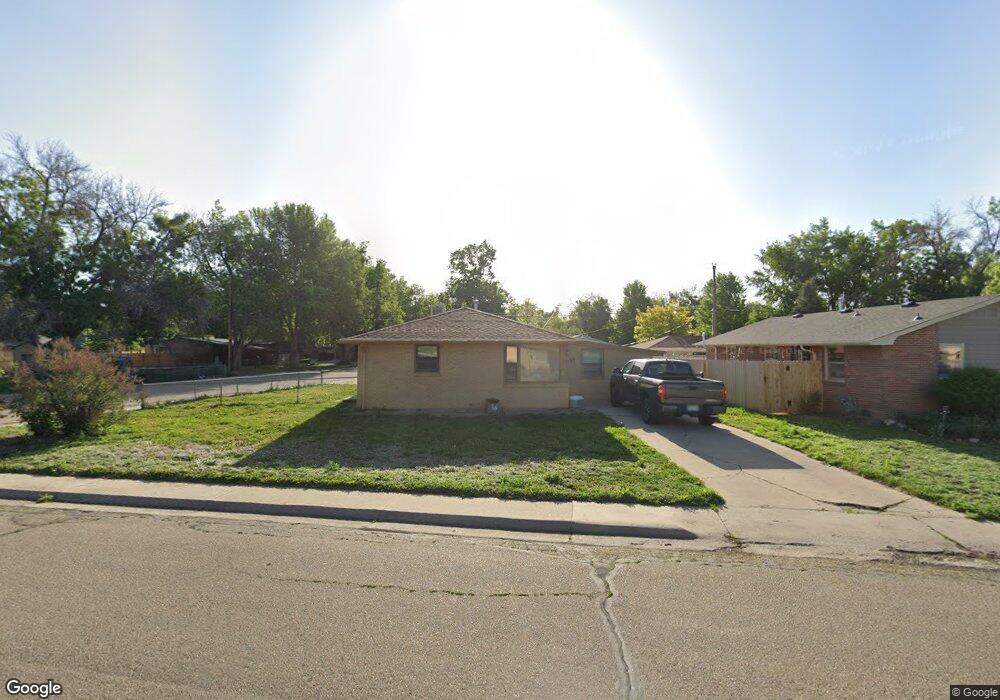
1148 Grant St Longmont, CO 80501
Loomiller NeighborhoodEstimated Value: $441,000 - $484,000
3
Beds
1
Bath
1,180
Sq Ft
$393/Sq Ft
Est. Value
About This Home
This home is located at 1148 Grant St, Longmont, CO 80501 and is currently estimated at $464,020, approximately $393 per square foot. 1148 Grant St is a home located in Boulder County with nearby schools including Mountain View Elementary School, Longs Peak Middle School, and Longmont High School.
Ownership History
Date
Name
Owned For
Owner Type
Purchase Details
Closed on
Nov 4, 2022
Sold by
Marlatt Properties Lllp
Bought by
Osprey Management Llc
Current Estimated Value
Purchase Details
Closed on
Dec 21, 2001
Sold by
W W Marlatt & Co
Bought by
Marlatt Properties Lllp
Purchase Details
Closed on
Jul 28, 1995
Sold by
Stang Virgil J
Bought by
W W Marlatt & Co and A M Marlatt & Co
Purchase Details
Closed on
Dec 16, 1994
Sold by
Grine Paul L and Grine Jodi M
Bought by
Stang Virgil J
Home Financials for this Owner
Home Financials are based on the most recent Mortgage that was taken out on this home.
Original Mortgage
$82,400
Interest Rate
9%
Purchase Details
Closed on
Dec 28, 1992
Bought by
Marlatt Properties Lllp
Purchase Details
Closed on
May 3, 1985
Bought by
Marlatt Properties Lllp
Create a Home Valuation Report for This Property
The Home Valuation Report is an in-depth analysis detailing your home's value as well as a comparison with similar homes in the area
Home Values in the Area
Average Home Value in this Area
Purchase History
| Date | Buyer | Sale Price | Title Company |
|---|---|---|---|
| Osprey Management Llc | -- | -- | |
| Marlatt Properties Lllp | -- | -- | |
| W W Marlatt & Co | $125,000 | -- | |
| Stang Virgil J | $103,000 | -- | |
| Marlatt Properties Lllp | $74,900 | -- | |
| Marlatt Properties Lllp | $150,000 | -- |
Source: Public Records
Mortgage History
| Date | Status | Borrower | Loan Amount |
|---|---|---|---|
| Previous Owner | Stang Virgil J | $82,400 |
Source: Public Records
Tax History Compared to Growth
Tax History
| Year | Tax Paid | Tax Assessment Tax Assessment Total Assessment is a certain percentage of the fair market value that is determined by local assessors to be the total taxable value of land and additions on the property. | Land | Improvement |
|---|---|---|---|---|
| 2025 | $2,597 | $27,875 | $5,481 | $22,394 |
| 2024 | $2,597 | $27,875 | $5,481 | $22,394 |
| 2023 | $2,561 | $27,148 | $6,104 | $24,730 |
| 2022 | $2,340 | $23,644 | $4,490 | $19,154 |
| 2021 | $2,370 | $24,324 | $4,619 | $19,705 |
| 2020 | $2,103 | $21,650 | $4,004 | $17,646 |
| 2019 | $2,070 | $21,650 | $4,004 | $17,646 |
| 2018 | $1,713 | $18,029 | $3,600 | $14,429 |
| 2017 | $1,689 | $19,932 | $3,980 | $15,952 |
| 2016 | $1,640 | $17,154 | $4,935 | $12,219 |
| 2015 | $1,563 | $14,272 | $4,537 | $9,735 |
| 2014 | $1,333 | $14,272 | $4,537 | $9,735 |
Source: Public Records
Map
Nearby Homes
- 1217 Lincoln St
- 1247 Lincoln St
- 1136 Venice St
- 1209 Gay St
- 1224 Judson St
- 1202 Vivian St
- 1314 Venice St
- 1153 Vivian St
- 1344 Aspen Place
- 1245 Sumner St
- 1208 Juniper St
- 1214 9th Ave
- 1365 15th Ave
- 1061 Townley Cir
- 1012 Pratt St Unit 1012
- 1019 Alta St Unit 1019
- 818 Lincoln St
- 900 Mountain View Ave Unit 213
- 814 Gay St
- 813 Vivian St