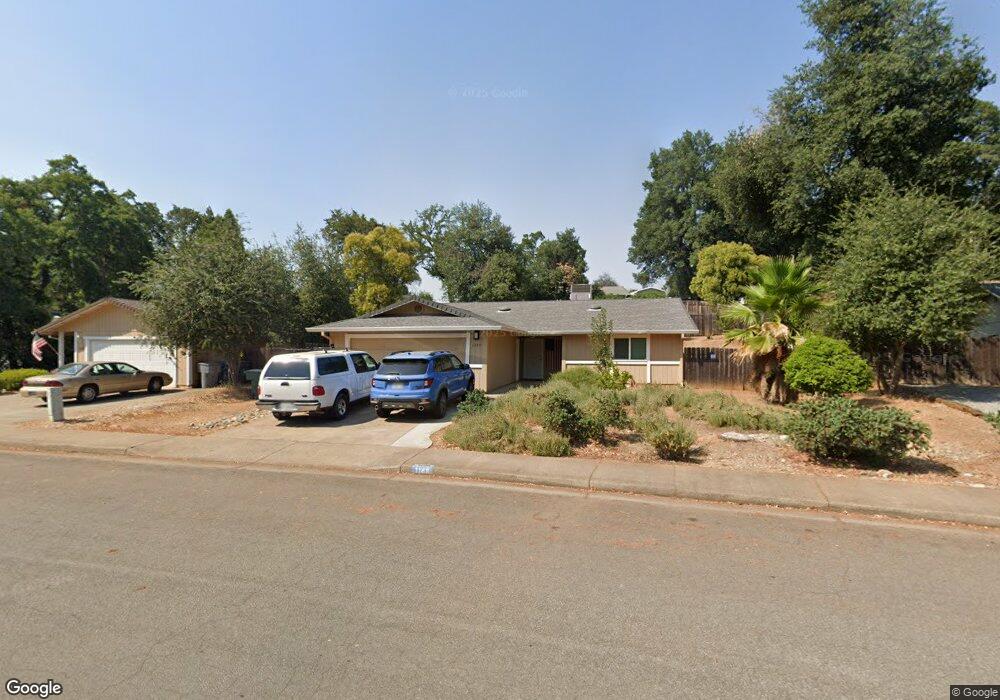
1149 Belcrest Dr Redding, CA 96003
Lema Ranch NeighborhoodEstimated Value: $298,000 - $356,000
3
Beds
2
Baths
1,289
Sq Ft
$259/Sq Ft
Est. Value
About This Home
This home is located at 1149 Belcrest Dr, Redding, CA 96003 and is currently estimated at $333,806, approximately $258 per square foot. 1149 Belcrest Dr is a home located in Shasta County with nearby schools including Mistletoe Elementary School, Foothill High School, and Redding School Of The Arts.
Ownership History
Date
Name
Owned For
Owner Type
Purchase Details
Closed on
Dec 5, 2019
Sold by
Wopschall Stephen K
Bought by
Wopschall April L and Wopschall Stephan K
Current Estimated Value
Home Financials for this Owner
Home Financials are based on the most recent Mortgage that was taken out on this home.
Original Mortgage
$128,900
Outstanding Balance
$87,700
Interest Rate
3.7%
Mortgage Type
New Conventional
Estimated Equity
$246,106
Purchase Details
Closed on
Aug 9, 2012
Sold by
Wopschall Stephen K and Wopschall Margaret A
Bought by
Wopschall Stephen K
Purchase Details
Closed on
Mar 26, 2010
Sold by
Department Of Veterans Affairs Of The St
Bought by
Secretary Of Veterans Affairs Of The Uni
Purchase Details
Closed on
Mar 3, 2010
Sold by
Secretary Of Veterans Affairs
Bought by
Wopschall Stephen K and Wopschall Margaret A
Purchase Details
Closed on
Mar 4, 2005
Sold by
Highet Pamela
Bought by
Va
Purchase Details
Closed on
Jun 3, 2002
Sold by
Page Michael A and Page Juana Dealva
Bought by
Highet Pamela
Home Financials for this Owner
Home Financials are based on the most recent Mortgage that was taken out on this home.
Original Mortgage
$85,000
Interest Rate
6.83%
Create a Home Valuation Report for This Property
The Home Valuation Report is an in-depth analysis detailing your home's value as well as a comparison with similar homes in the area
Home Values in the Area
Average Home Value in this Area
Purchase History
| Date | Buyer | Sale Price | Title Company |
|---|---|---|---|
| Wopschall April L | -- | Placer Title Company | |
| Wopschall Stephen K | -- | None Available | |
| Secretary Of Veterans Affairs Of The Uni | -- | Fidelity National Title | |
| Wopschall Stephen K | $165,000 | First American Title Company | |
| Va | $244,000 | Chicago Title Co | |
| Highet Pamela | $135,000 | Alliance Title Company |
Source: Public Records
Mortgage History
| Date | Status | Borrower | Loan Amount |
|---|---|---|---|
| Open | Wopschall April L | $128,900 | |
| Previous Owner | Highet Pamela | $85,000 |
Source: Public Records
Tax History
| Year | Tax Paid | Tax Assessment Tax Assessment Total Assessment is a certain percentage of the fair market value that is determined by local assessors to be the total taxable value of land and additions on the property. | Land | Improvement |
|---|---|---|---|---|
| 2025 | $2,249 | $212,970 | $64,533 | $148,437 |
| 2024 | $2,216 | $208,795 | $63,268 | $145,527 |
| 2023 | $2,216 | $204,702 | $62,028 | $142,674 |
| 2022 | $2,152 | $200,689 | $60,812 | $139,877 |
| 2021 | $2,077 | $196,755 | $59,620 | $137,135 |
| 2020 | $2,067 | $194,738 | $59,009 | $135,729 |
| 2019 | $2,049 | $190,920 | $57,852 | $133,068 |
| 2018 | $2,024 | $187,177 | $56,718 | $130,459 |
| 2017 | $2,058 | $183,507 | $55,606 | $127,901 |
| 2016 | $1,924 | $179,910 | $54,516 | $125,394 |
| 2015 | $1,907 | $177,209 | $53,698 | $123,511 |
| 2014 | $1,892 | $173,739 | $52,647 | $121,092 |
Source: Public Records
Map
Nearby Homes
- 965 Willow Brook Ln
- 1110 Grouse Dr
- 1090 Gibralter Rd
- 1285 Lancers Ln
- 1088 Burton Dr
- 1939 Cameo Ct
- 2134 Cadjew St
- 2093 Victor Ave
- 2935 Snow Fire Ct
- 1637 French Lace Ln
- 2182 Cadjew St
- 550 Armando Ave
- 1461 Oakdale Ln
- 667 Reddington Dr
- 547 Casa Buena St
- 771 Flower Ash Ln
- 790 Volcano View Trail
- 825 Mission Sierra Ct
- 10033 Abernathy Ln
- 332 Franciscan Trail
- 1141 Belcrest Dr
- 1157 Belcrest Dr
- 1133 Belcrest Dr
- 1146 Belcrest Dr
- 1165 Belcrest Dr
- 1973 S Ridge Dr
- 1162 Belcrest Dr
- 1134 Belcrest Dr
- 1125 Belcrest Dr
- 1995 S Ridge Dr
- 1951 S Ridge Dr
- 2001 S Ridge Dr
- 1173 Belcrest Dr
- 1178 Belcrest Dr
- 1128 Belcrest Dr
- 2013 S Ridge Dr
- 1155 Hanover Ct
- 1128 Peregrine Way
- 1124 Peregrine Way
- 1100 Hanover Ct
Your Personal Tour Guide
Ask me questions while you tour the home.