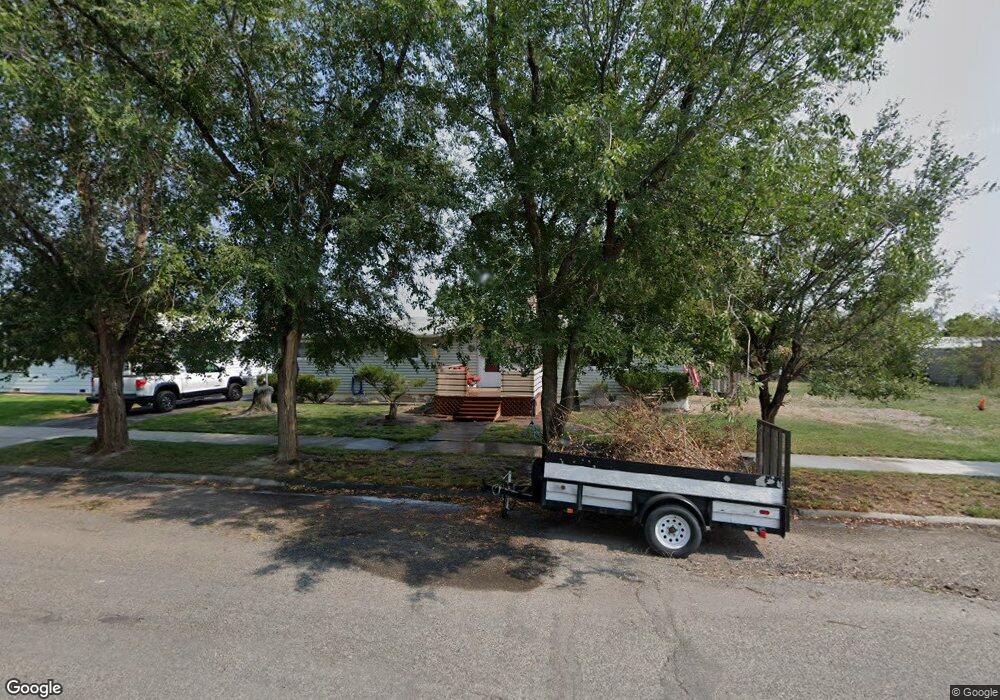
115 7th Ave Laurel, MT 59044
Estimated Value: $264,000 - $348,000
2
Beds
2
Baths
1,440
Sq Ft
$217/Sq Ft
Est. Value
About This Home
This home is located at 115 7th Ave, Laurel, MT 59044 and is currently estimated at $312,247, approximately $216 per square foot. 115 7th Ave is a home located in Yellowstone County with nearby schools including West School, Fred W. Graff School, and Laurel Middle School.
Ownership History
Date
Name
Owned For
Owner Type
Purchase Details
Closed on
May 8, 2024
Sold by
Meili Carolyn M
Bought by
Mccrabb Brittney
Current Estimated Value
Home Financials for this Owner
Home Financials are based on the most recent Mortgage that was taken out on this home.
Original Mortgage
$225,834
Outstanding Balance
$222,613
Interest Rate
6.79%
Mortgage Type
FHA
Estimated Equity
$89,634
Purchase Details
Closed on
Feb 16, 2007
Sold by
Meili Carolyn M and Meili Larry Dean
Bought by
Meili Carolyn M
Home Financials for this Owner
Home Financials are based on the most recent Mortgage that was taken out on this home.
Original Mortgage
$225,000
Interest Rate
6.57%
Mortgage Type
Reverse Mortgage Home Equity Conversion Mortgage
Purchase Details
Closed on
Aug 16, 2005
Sold by
Meili Carolyn M and Kumpula Carolyn M
Bought by
Meili Carolyn M and Meili Larry Dean
Create a Home Valuation Report for This Property
The Home Valuation Report is an in-depth analysis detailing your home's value as well as a comparison with similar homes in the area
Home Values in the Area
Average Home Value in this Area
Purchase History
| Date | Buyer | Sale Price | Title Company |
|---|---|---|---|
| Mccrabb Brittney | -- | None Listed On Document | |
| Meili Carolyn M | -- | None Available | |
| Meili Carolyn M | -- | None Available |
Source: Public Records
Mortgage History
| Date | Status | Borrower | Loan Amount |
|---|---|---|---|
| Open | Mccrabb Brittney | $225,834 | |
| Previous Owner | Meili Carolyn M | $225,000 |
Source: Public Records
Tax History
| Year | Tax Paid | Tax Assessment Tax Assessment Total Assessment is a certain percentage of the fair market value that is determined by local assessors to be the total taxable value of land and additions on the property. | Land | Improvement |
|---|---|---|---|---|
| 2025 | $2,633 | $349,500 | $68,532 | $280,968 |
| 2024 | $2,633 | $249,200 | $44,784 | $204,416 |
| 2023 | $2,443 | $249,200 | $44,784 | $204,416 |
| 2022 | $1,703 | $204,100 | $0 | $0 |
| 2021 | $2,161 | $204,100 | $0 | $0 |
| 2020 | $2,088 | $197,300 | $0 | $0 |
| 2019 | $2,144 | $197,300 | $0 | $0 |
| 2018 | $2,128 | $194,200 | $0 | $0 |
| 2017 | $1,976 | $194,200 | $0 | $0 |
| 2016 | $1,969 | $196,000 | $0 | $0 |
| 2015 | $1,947 | $196,000 | $0 | $0 |
| 2014 | $1,782 | $92,962 | $0 | $0 |
Source: Public Records
Map
Nearby Homes
- 102 8th Ave Unit B
- 319 6th Ave
- 116 4th Ave
- 310 (and 814 w 4) 8th Ave
- 120 Forrest Ave
- 208 West Ave
- 603 5th Ave
- 211 Woodland Ave
- 110 E 5th St
- 419 Durland Ave
- 409 Maple Ave
- 516 Pennsylvania Ave
- 414 Wyoming Ave
- 1109 10th Ave
- 601 E 5th St
- 1014 Rochelle Ln
- 1013 W 12th St
- TBD Block 3 Lot 6
- 717 E 5th St
- 717 E 5th, 506 Alder Ave
Your Personal Tour Guide
Ask me questions while you tour the home.