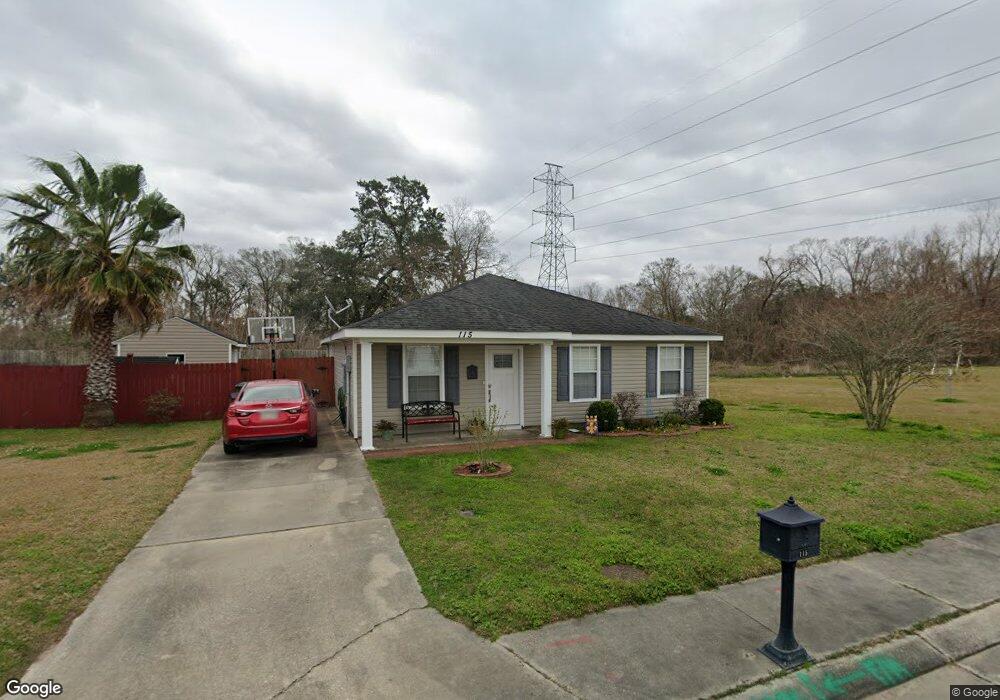
115 Allie Ln Luling, LA 70070
Estimated Value: $221,000 - $233,773
3
Beds
2
Baths
1,225
Sq Ft
$186/Sq Ft
Est. Value
About This Home
This home is located at 115 Allie Ln, Luling, LA 70070 and is currently estimated at $227,693, approximately $185 per square foot. 115 Allie Ln is a home located in St. Charles Parish with nearby schools including Luling Elementary School, R.K. Smith Middle School, and Hahnville High School.
Ownership History
Date
Name
Owned For
Owner Type
Purchase Details
Closed on
Mar 26, 2008
Sold by
Us Bank N A
Bought by
Lirette Delpino Jennifer Marie and Lirette Del Pino
Current Estimated Value
Home Financials for this Owner
Home Financials are based on the most recent Mortgage that was taken out on this home.
Original Mortgage
$134,900
Outstanding Balance
$85,668
Interest Rate
6.19%
Mortgage Type
New Conventional
Estimated Equity
$142,025
Purchase Details
Closed on
May 2, 2006
Sold by
Jjj Development Partners L L C
Bought by
Collura Jason R
Home Financials for this Owner
Home Financials are based on the most recent Mortgage that was taken out on this home.
Original Mortgage
$25,800
Interest Rate
6.4%
Mortgage Type
Stand Alone Second
Create a Home Valuation Report for This Property
The Home Valuation Report is an in-depth analysis detailing your home's value as well as a comparison with similar homes in the area
Home Values in the Area
Average Home Value in this Area
Purchase History
| Date | Buyer | Sale Price | Title Company |
|---|---|---|---|
| Lirette Delpino Jennifer Marie | $134,900 | None Available | |
| Collura Jason R | $129,000 | Choice Title |
Source: Public Records
Mortgage History
| Date | Status | Borrower | Loan Amount |
|---|---|---|---|
| Open | Lirette Delpino Jennifer Marie | $134,900 | |
| Previous Owner | Collura Jason R | $25,800 | |
| Previous Owner | Collura Jason R | $103,200 |
Source: Public Records
Tax History Compared to Growth
Tax History
| Year | Tax Paid | Tax Assessment Tax Assessment Total Assessment is a certain percentage of the fair market value that is determined by local assessors to be the total taxable value of land and additions on the property. | Land | Improvement |
|---|---|---|---|---|
| 2024 | $1,297 | $20,330 | $3,330 | $17,000 |
| 2023 | $1,317 | $14,696 | $3,330 | $11,366 |
| 2022 | $1,719 | $14,696 | $3,330 | $11,366 |
| 2021 | $1,319 | $11,180 | $2,997 | $8,183 |
| 2020 | $1,736 | $14,696 | $3,330 | $11,366 |
| 2019 | $1,550 | $13,073 | $2,332 | $10,741 |
| 2018 | $1,538 | $13,073 | $2,332 | $10,741 |
| 2017 | $1,536 | $13,073 | $2,332 | $10,741 |
| 2016 | $1,543 | $13,073 | $2,332 | $10,741 |
| 2015 | $587 | $12,495 | $2,120 | $10,375 |
| 2014 | $566 | $12,495 | $2,120 | $10,375 |
| 2013 | $568 | $12,495 | $2,120 | $10,375 |
Source: Public Records
Map
Nearby Homes
- 1216 Gassen St
- 1214 Gassen St
- 201 Ashton Oaks Ln
- 1282 Luling Estates Dr
- 214 Ashton Oaks Ln
- 301 Allie Ln
- 1023 Gassen St
- 1008 Gassen St
- 324 Ashton Oaks Ln
- 207 Lac Iberville Dr
- 405 Ashton Oaks Ln
- 118 Lac Segnette Dr
- 225 Cove Pointe Dr
- 116 Cove Pointe Dr
- 109 Cove Glen Ln
- 109 Moonlight Cove Ln
- 132 Moonlight Cove Ln
- 617 Gassen St
- 313 Post Dr
- 708 Sugarhouse Rd