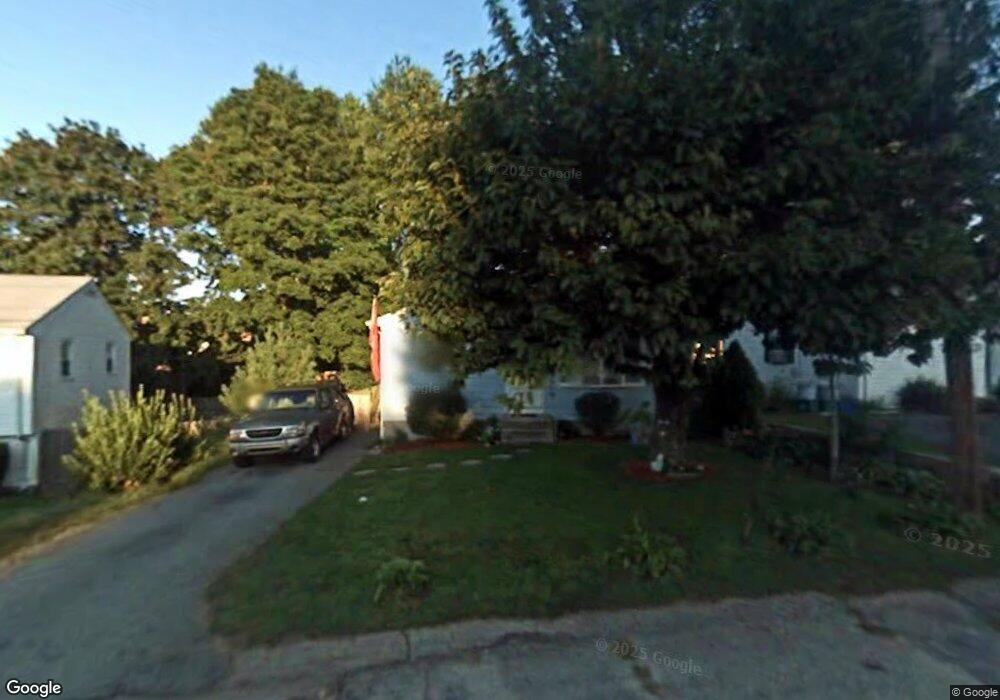
115 Arcadia Ave Cranston, RI 02910
Park View NeighborhoodEstimated Value: $369,000 - $417,000
3
Beds
2
Baths
1,632
Sq Ft
$244/Sq Ft
Est. Value
About This Home
This home is located at 115 Arcadia Ave, Cranston, RI 02910 and is currently estimated at $398,939, approximately $244 per square foot. 115 Arcadia Ave is a home located in Providence County with nearby schools including Edgewood Highland Elementary School, Edward S. Rhodes School, and Park View Middle School.
Ownership History
Date
Name
Owned For
Owner Type
Purchase Details
Closed on
Apr 16, 2004
Sold by
Lapine Anne and Redding David
Bought by
Silvia Calixto and Garafano Cherie
Current Estimated Value
Home Financials for this Owner
Home Financials are based on the most recent Mortgage that was taken out on this home.
Original Mortgage
$186,966
Outstanding Balance
$86,828
Interest Rate
5.58%
Mortgage Type
Purchase Money Mortgage
Estimated Equity
$312,111
Purchase Details
Closed on
May 31, 2002
Sold by
Santos Lawrence J and Santos Coralia
Bought by
Lapine Anne L and Redding David
Home Financials for this Owner
Home Financials are based on the most recent Mortgage that was taken out on this home.
Original Mortgage
$135,000
Interest Rate
7%
Purchase Details
Closed on
Oct 21, 1991
Sold by
Pelopida Joseph R
Bought by
Santos Laurence J
Home Financials for this Owner
Home Financials are based on the most recent Mortgage that was taken out on this home.
Original Mortgage
$99,700
Interest Rate
9.06%
Create a Home Valuation Report for This Property
The Home Valuation Report is an in-depth analysis detailing your home's value as well as a comparison with similar homes in the area
Home Values in the Area
Average Home Value in this Area
Purchase History
| Date | Buyer | Sale Price | Title Company |
|---|---|---|---|
| Silvia Calixto | $190,000 | -- | |
| Lapine Anne L | $150,000 | -- | |
| Santos Laurence J | $105,000 | -- |
Source: Public Records
Mortgage History
| Date | Status | Borrower | Loan Amount |
|---|---|---|---|
| Open | Santos Laurence J | $186,966 | |
| Previous Owner | Santos Laurence J | $135,000 | |
| Previous Owner | Santos Laurence J | $89,500 | |
| Previous Owner | Santos Laurence J | $99,700 |
Source: Public Records
Tax History
| Year | Tax Paid | Tax Assessment Tax Assessment Total Assessment is a certain percentage of the fair market value that is determined by local assessors to be the total taxable value of land and additions on the property. | Land | Improvement |
|---|---|---|---|---|
| 2025 | $4,172 | $300,600 | $94,000 | $206,600 |
| 2024 | $4,091 | $300,600 | $94,000 | $206,600 |
| 2023 | $3,973 | $210,200 | $64,800 | $145,400 |
| 2022 | $3,891 | $210,200 | $64,800 | $145,400 |
| 2021 | $3,784 | $210,200 | $64,800 | $145,400 |
| 2020 | $3,560 | $171,400 | $61,600 | $109,800 |
| 2019 | $3,560 | $171,400 | $61,600 | $109,800 |
| 2018 | $3,478 | $171,400 | $61,600 | $109,800 |
| 2017 | $3,296 | $143,700 | $45,400 | $98,300 |
| 2016 | $3,226 | $143,700 | $45,400 | $98,300 |
| 2015 | $3,226 | $143,700 | $45,400 | $98,300 |
| 2014 | $2,991 | $138,800 | $45,400 | $93,400 |
Source: Public Records
Map
Nearby Homes
- 111 Arcadia Ave
- 121 Arcadia Ave
- 114 Park View Blvd
- 122 Park View Blvd
- 110 Park View Blvd
- 126 Park View Blvd
- 106 Park View Blvd
- 101 Arcadia Ave
- 127 Arcadia Ave
- 120 Arcadia Ave
- 128 Park View Blvd
- 100 Arcadia Ave
- 100 Park View Blvd
- 96 Arcadia Ave
- 95 Arcadia Ave
- 98 Park View Blvd
- 135 Arcadia Ave
- 130 Arcadia Ave
- 94 Arcadia Ave
- 5 Minola St
Your Personal Tour Guide
Ask me questions while you tour the home.