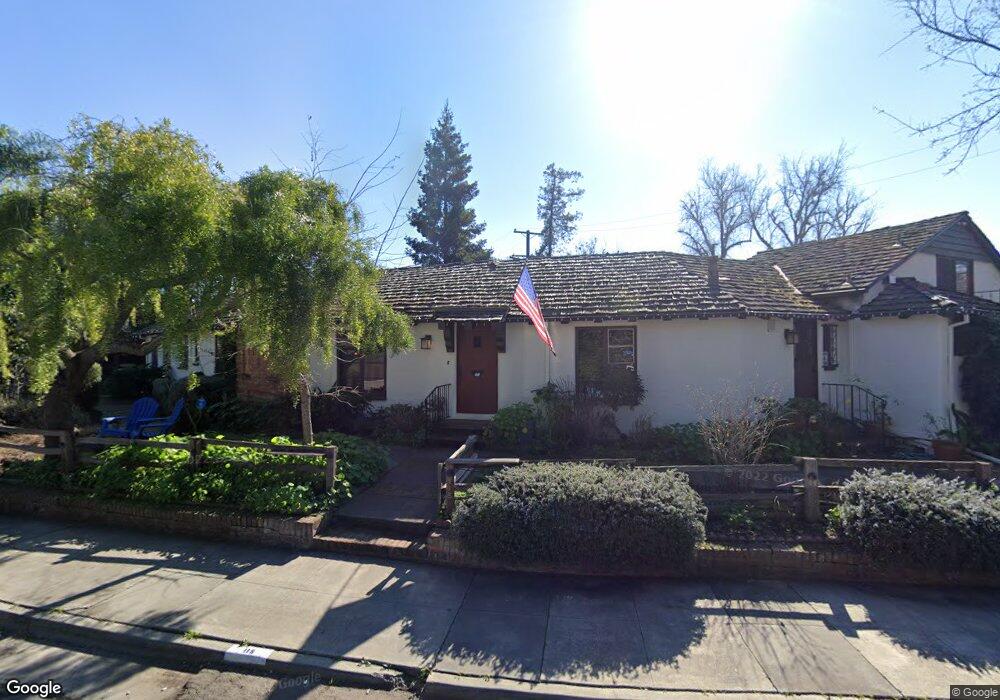
115 Arroyo Way San Jose, CA 95112
Naglee Park NeighborhoodEstimated Value: $1,288,812 - $1,687,000
3
Beds
3
Baths
1,756
Sq Ft
$853/Sq Ft
Est. Value
About This Home
This home is located at 115 Arroyo Way, San Jose, CA 95112 and is currently estimated at $1,498,203, approximately $853 per square foot. 115 Arroyo Way is a home located in Santa Clara County with nearby schools including Horace Mann Elementary School, Muwekma Ohlone Middle, and San Jose High School.
Ownership History
Date
Name
Owned For
Owner Type
Purchase Details
Closed on
Sep 26, 2006
Sold by
Potter Michael and Chavez Cynthia
Bought by
Potter Michael and Chavez Cynthia
Current Estimated Value
Home Financials for this Owner
Home Financials are based on the most recent Mortgage that was taken out on this home.
Original Mortgage
$648,000
Outstanding Balance
$400,586
Interest Rate
7.12%
Mortgage Type
New Conventional
Estimated Equity
$1,097,617
Purchase Details
Closed on
Dec 17, 2002
Sold by
Eliason Geraldine M
Bought by
Potter Michael and Chavez Cynthia
Home Financials for this Owner
Home Financials are based on the most recent Mortgage that was taken out on this home.
Original Mortgage
$476,000
Interest Rate
4.12%
Create a Home Valuation Report for This Property
The Home Valuation Report is an in-depth analysis detailing your home's value as well as a comparison with similar homes in the area
Home Values in the Area
Average Home Value in this Area
Purchase History
| Date | Buyer | Sale Price | Title Company |
|---|---|---|---|
| Potter Michael | -- | Alliance Title Company | |
| Potter Michael | $595,000 | Alliance Title Company |
Source: Public Records
Mortgage History
| Date | Status | Borrower | Loan Amount |
|---|---|---|---|
| Open | Potter Michael | $648,000 | |
| Closed | Potter Michael | $476,000 | |
| Closed | Potter Michael | $89,250 |
Source: Public Records
Tax History Compared to Growth
Tax History
| Year | Tax Paid | Tax Assessment Tax Assessment Total Assessment is a certain percentage of the fair market value that is determined by local assessors to be the total taxable value of land and additions on the property. | Land | Improvement |
|---|---|---|---|---|
| 2025 | $11,376 | $861,741 | $603,221 | $258,520 |
| 2024 | $11,376 | $844,845 | $591,394 | $253,451 |
| 2023 | $11,153 | $828,281 | $579,799 | $248,482 |
| 2022 | $11,038 | $812,041 | $568,431 | $243,610 |
| 2021 | $10,801 | $796,120 | $557,286 | $238,834 |
| 2020 | $10,554 | $787,958 | $551,572 | $236,386 |
| 2019 | $10,323 | $772,508 | $540,757 | $231,751 |
| 2018 | $10,216 | $757,361 | $530,154 | $227,207 |
| 2017 | $10,133 | $742,511 | $519,759 | $222,752 |
| 2016 | $9,951 | $727,953 | $509,568 | $218,385 |
| 2015 | $9,885 | $717,019 | $501,914 | $215,105 |
| 2014 | $9,371 | $702,975 | $492,083 | $210,892 |
Source: Public Records
Map
Nearby Homes
- 850 Calhoun St
- 188 S 14th St
- 18 S 21st St Unit 200
- 551 S 15th St
- 101 S 13th St
- 30 S 22nd St Unit 6
- 30 S 22nd St Unit 2
- 39 S 23rd St
- 214 S 22nd St
- 199 S 23rd St
- 55 Carnegie Square
- 396 S 18th St
- 75 S 24th St
- 339 S 13th St
- 415 S 14th St
- 987 E William St
- 255 S 24th St
- 351 S 23rd St Unit A
- 1236 Whitton Ave
- 384 S 11th St