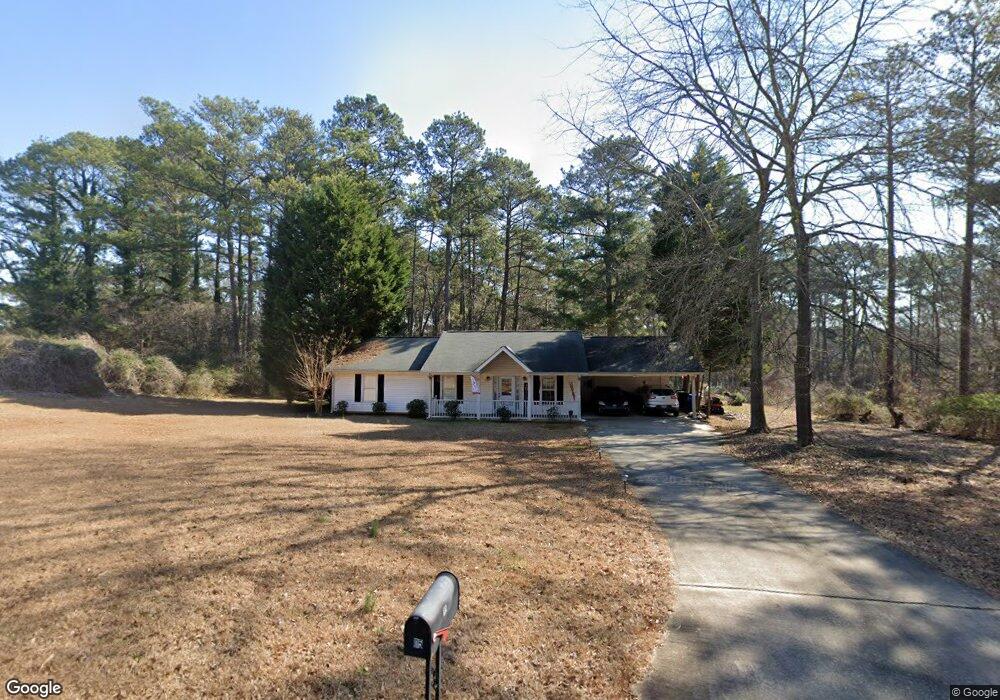
115 Cactus Ln E Stockbridge, GA 30281
Estimated Value: $229,000 - $257,000
3
Beds
2
Baths
1,416
Sq Ft
$174/Sq Ft
Est. Value
About This Home
This home is located at 115 Cactus Ln E, Stockbridge, GA 30281 and is currently estimated at $246,374, approximately $173 per square foot. 115 Cactus Ln E is a home located in Henry County with nearby schools including Cotton Indian Elementary School, Stockbridge Middle School, and Stockbridge High School.
Ownership History
Date
Name
Owned For
Owner Type
Purchase Details
Closed on
Sep 13, 2019
Sold by
115 Cactus Lane Llc
Bought by
Burns Allison
Current Estimated Value
Home Financials for this Owner
Home Financials are based on the most recent Mortgage that was taken out on this home.
Original Mortgage
$106,868
Outstanding Balance
$93,415
Interest Rate
3.5%
Mortgage Type
FHA
Estimated Equity
$152,959
Purchase Details
Closed on
Mar 26, 2012
Sold by
Simpson Larry
Bought by
115 Cactus Lane Llc
Purchase Details
Closed on
Feb 23, 2001
Sold by
Evans Christopher and Evans P J
Bought by
J P Evans Const Co Inc
Purchase Details
Closed on
Aug 28, 2000
Sold by
J P Evans Const Co Inc
Bought by
Evans Chritopher and Evans P J
Home Financials for this Owner
Home Financials are based on the most recent Mortgage that was taken out on this home.
Original Mortgage
$83,175
Interest Rate
8.11%
Mortgage Type
New Conventional
Create a Home Valuation Report for This Property
The Home Valuation Report is an in-depth analysis detailing your home's value as well as a comparison with similar homes in the area
Home Values in the Area
Average Home Value in this Area
Purchase History
| Date | Buyer | Sale Price | Title Company |
|---|---|---|---|
| Burns Allison | $135,000 | -- | |
| 115 Cactus Lane Llc | -- | -- | |
| J P Evans Const Co Inc | -- | -- | |
| Evans Chritopher | $19,500 | -- |
Source: Public Records
Mortgage History
| Date | Status | Borrower | Loan Amount |
|---|---|---|---|
| Open | Burns Allison | $106,868 | |
| Previous Owner | Evans Chritopher | $83,175 |
Source: Public Records
Tax History Compared to Growth
Tax History
| Year | Tax Paid | Tax Assessment Tax Assessment Total Assessment is a certain percentage of the fair market value that is determined by local assessors to be the total taxable value of land and additions on the property. | Land | Improvement |
|---|---|---|---|---|
| 2025 | $4,124 | $98,920 | $14,000 | $84,920 |
| 2024 | $4,124 | $96,120 | $14,000 | $82,120 |
| 2023 | $4,113 | $95,240 | $12,000 | $83,240 |
| 2022 | $2,572 | $66,000 | $10,000 | $56,000 |
| 2021 | $2,179 | $55,760 | $10,000 | $45,760 |
| 2020 | $1,962 | $50,120 | $8,000 | $42,120 |
| 2019 | $1,570 | $47,440 | $9,200 | $38,240 |
| 2018 | $0 | $44,360 | $9,200 | $35,160 |
| 2016 | $1,511 | $38,360 | $6,920 | $31,440 |
| 2015 | $1,475 | $36,280 | $6,920 | $29,360 |
| 2014 | $1,454 | $35,320 | $5,520 | $29,800 |
Source: Public Records
Map
Nearby Homes
- 110 Cactus Ln E
- 20 Highlane Dr
- 952 E Atlanta Rd
- Dallas Plan at Diamante
- Austin Plan at Diamante
- 300 Shine Dr
- 1600 Gallup Dr
- 120 Mossy Brook Dr
- 485 Brunswick Cir
- 124 Meadow Ridge Dr Unit I
- 245 Amanda Ct
- 0 Stagecoach Rd Unit 20.17 ACRES 10455441
- 101 Bridge Park Ct
- 905 E Atlanta Rd
- 515 Valley Hill Rd
- 145 Davis Rd
- 805 Abarca Ln
- 809 Abarca Ln
- 115 Creek Cir
- 813 Abarca Ln
- 0 Cactus Ln Unit 10141257
- 0 Cactus Ln Unit 3170537
- 0 Cactus Ln
- 119 Cactus Ln E
- 60 Stagecoach Cir
- 70 Stagecoach Cir
- 199 Old Stagecoach Rd
- 114 Cactus Ln E
- 114 Cactus Ln E Unit N\
- 125 Cactus Ln E
- 118 Cactus Ln E
- 165 Old Stagecoach Rd
- 50 Stagecoach Cir
- 80 Stagecoach Cir
- 122 Cactus Ln E
- 131 Cactus Ln E
- 126 Cactus Ln E
- 0 Old Stagecoach Rd Unit 8073027
- 0 Old Stagecoach Rd Unit 8251037
- 40 Stagecoach Cir