Estimated Value: $298,000 - $308,000
Studio
2
Baths
1,056
Sq Ft
$286/Sq Ft
Est. Value
About This Home
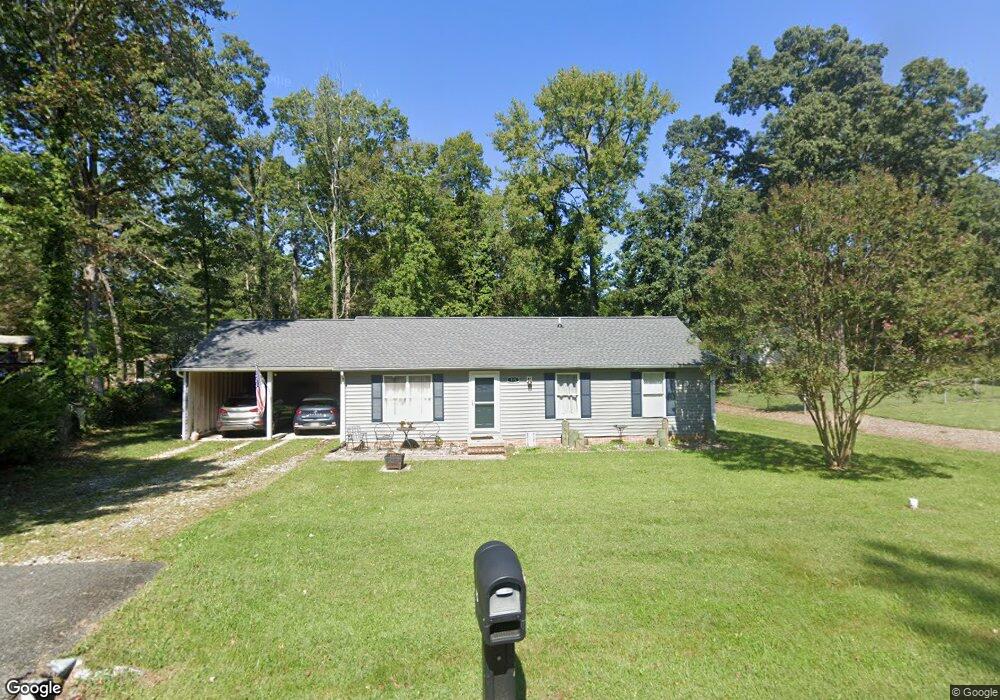
This home is located at 115 Cross Rd, Lusby, MD 20657 and is currently estimated at $302,480, approximately $286 per square foot. 115 Cross Rd is a home located in Calvert County with nearby schools including St Leonard Elementary School, Southern Middle School, and Calvert High School.
Ownership History
Date
Name
Owned For
Owner Type
Purchase Details
Closed on
Mar 6, 1997
Sold by
Hildebrand Wanda E
Bought by
Hinkle Roy E and Hinkle Laura P
Current Estimated Value
Purchase Details
Closed on
Jun 4, 1992
Sold by
Mattingly Edward Brett
Bought by
Hildebrand Wanda E
Home Financials for this Owner
Home Financials are based on the most recent Mortgage that was taken out on this home.
Original Mortgage
$92,800
Interest Rate
8.6%
Purchase Details
Closed on
Dec 23, 1988
Sold by
Triple H Limited
Bought by
Mattingly Edward Brett
Home Financials for this Owner
Home Financials are based on the most recent Mortgage that was taken out on this home.
Original Mortgage
$85,531
Interest Rate
10.68%
Create a Home Valuation Report for This Property
The Home Valuation Report is an in-depth analysis detailing your home's value as well as a comparison with similar homes in the area
Home Values in the Area
Average Home Value in this Area
Purchase History
| Date | Buyer | Sale Price | Title Company |
|---|---|---|---|
| Hinkle Roy E | $102,000 | -- | |
| Hildebrand Wanda E | $97,700 | -- | |
| Mattingly Edward Brett | $83,500 | -- |
Source: Public Records
Mortgage History
| Date | Status | Borrower | Loan Amount |
|---|---|---|---|
| Previous Owner | Hildebrand Wanda E | $92,800 | |
| Previous Owner | Mattingly Edward Brett | $85,531 | |
| Closed | Hinkle Roy E | -- |
Source: Public Records
Tax History
| Year | Tax Paid | Tax Assessment Tax Assessment Total Assessment is a certain percentage of the fair market value that is determined by local assessors to be the total taxable value of land and additions on the property. | Land | Improvement |
|---|---|---|---|---|
| 2025 | $2,428 | $204,467 | $0 | $0 |
| 2024 | $2,244 | $187,833 | $0 | $0 |
| 2023 | $1,779 | $171,200 | $70,000 | $101,200 |
| 2022 | $1,938 | $166,233 | $0 | $0 |
| 2021 | $1,837 | $161,267 | $0 | $0 |
| 2020 | $1,837 | $156,300 | $70,000 | $86,300 |
| 2019 | $1,774 | $149,900 | $0 | $0 |
| 2018 | $1,694 | $143,500 | $0 | $0 |
| 2017 | $1,645 | $137,100 | $0 | $0 |
| 2016 | -- | $137,100 | $0 | $0 |
| 2015 | $2,095 | $137,100 | $0 | $0 |
| 2014 | $2,095 | $155,500 | $0 | $0 |
Source: Public Records
Map
Nearby Homes
Your Personal Tour Guide
Ask me questions while you tour the home.