Estimated Value: $198,000 - $214,405
3
Beds
2
Baths
1,357
Sq Ft
$152/Sq Ft
Est. Value
About This Home
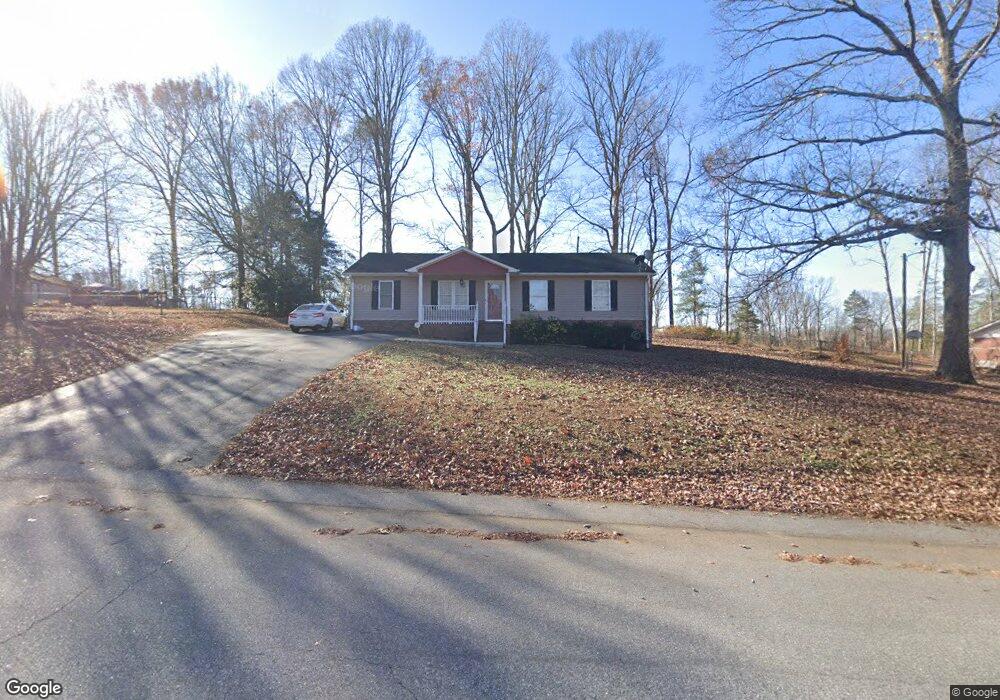
This home is located at 115 Dale St, Moore, SC 29369 and is currently estimated at $206,601, approximately $152 per square foot. 115 Dale St is a home located in Spartanburg County with nearby schools including Dorman High School Freshman Campus, Dorman High School, and Westgate Christian School.
Ownership History
Date
Name
Owned For
Owner Type
Purchase Details
Closed on
Aug 30, 2024
Sold by
Satterfield Debra B
Bought by
Smith Sharon and Hylemon Thomas
Current Estimated Value
Home Financials for this Owner
Home Financials are based on the most recent Mortgage that was taken out on this home.
Original Mortgage
$8,000
Outstanding Balance
$7,915
Interest Rate
6.77%
Estimated Equity
$198,686
Purchase Details
Closed on
Aug 18, 2011
Sold by
Tm Properties Llc
Bought by
Satterfield Debra B
Purchase Details
Closed on
Aug 12, 2010
Sold by
J & A Southern Properties Llc
Bought by
Tm Properties Llc
Purchase Details
Closed on
Aug 28, 2009
Sold by
Estate Of Jeffery Noel Shults
Bought by
Shults Jane Haley and Shults Lauren Haley
Purchase Details
Closed on
Dec 16, 2005
Sold by
Thompson William and Thompson Kimberly
Bought by
Shults Jeffrey and Shults Jane
Purchase Details
Closed on
Mar 10, 2000
Sold by
Tisdale Richard H
Bought by
Thompson Kimberly and Thompson William
Create a Home Valuation Report for This Property
The Home Valuation Report is an in-depth analysis detailing your home's value as well as a comparison with similar homes in the area
Home Values in the Area
Average Home Value in this Area
Purchase History
| Date | Buyer | Sale Price | Title Company |
|---|---|---|---|
| Smith Sharon | $200,000 | None Listed On Document | |
| Satterfield Debra B | $79,000 | -- | |
| Tm Properties Llc | $10,000 | -- | |
| Shults Jane Haley | -- | -- | |
| Shults Jeffrey | $6,800 | None Available | |
| Thompson Kimberly | $79,000 | -- |
Source: Public Records
Mortgage History
| Date | Status | Borrower | Loan Amount |
|---|---|---|---|
| Open | Smith Sharon | $8,000 | |
| Open | Smith Sharon | $196,377 |
Source: Public Records
Tax History Compared to Growth
Tax History
| Year | Tax Paid | Tax Assessment Tax Assessment Total Assessment is a certain percentage of the fair market value that is determined by local assessors to be the total taxable value of land and additions on the property. | Land | Improvement |
|---|---|---|---|---|
| 2025 | $2,313 | $12,000 | $1,152 | $10,848 |
| 2024 | $2,313 | $6,094 | $763 | $5,331 |
| 2023 | $2,313 | $6,094 | $763 | $5,331 |
| 2022 | $2,114 | $5,299 | $886 | $4,413 |
| 2021 | $2,101 | $5,299 | $886 | $4,413 |
| 2020 | $2,076 | $5,299 | $886 | $4,413 |
| 2019 | $2,049 | $3,533 | $591 | $2,942 |
| 2018 | $682 | $3,533 | $591 | $2,942 |
| 2017 | $593 | $3,072 | $640 | $2,432 |
| 2016 | $606 | $3,072 | $640 | $2,432 |
| 2015 | $591 | $3,072 | $640 | $2,432 |
| 2014 | $571 | $3,072 | $640 | $2,432 |
Source: Public Records
Map
Nearby Homes
- 1337 Pitch Pine Place
- 1325 Pitch Pine Place
- 1321 Pitch Pine Place
- 1428 Wild Indigo Way
- 1486 Wild Indigo Way
- 1482 Wild Indigo Way
- 1424 Wild Indigo Way
- 1432 Wild Indigo Way
- 1229 Crested Iris St
- 1233 Crested Iris St
- 1208 Crested Iris St
- 1243 Crested Iris St
- 1237 Crested Iris St
- 1205 Crested Iris St
- 1073 Mossy Oak Dr
- 1069 Mossy Oak Dr
- Harris Plan at Henson Creek Farms
- Edgefield Plan at Henson Creek Farms
- Carolina Plan at Henson Creek Farms