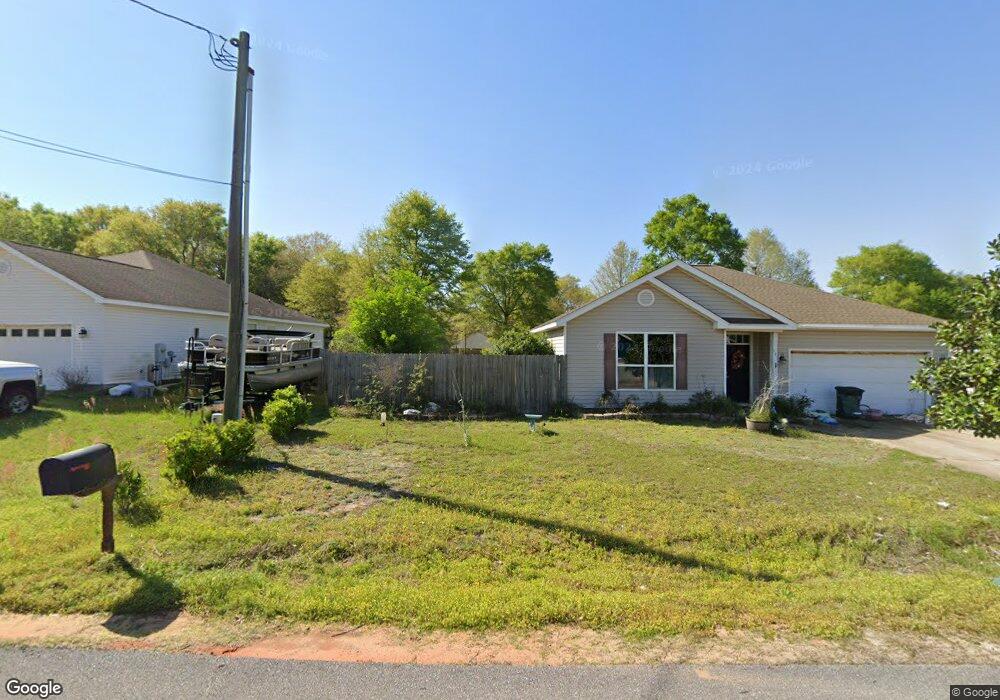
115 E Michaelangelo Rd Defuniak Springs, FL 32433
Estimated Value: $235,000 - $252,000
3
Beds
2
Baths
1,433
Sq Ft
$171/Sq Ft
Est. Value
About This Home
This home is located at 115 E Michaelangelo Rd, Defuniak Springs, FL 32433 and is currently estimated at $244,576, approximately $170 per square foot. 115 E Michaelangelo Rd is a home located in Walton County with nearby schools including Maude Saunders Elementary School, West Defuniak Elementary School, and Walton Middle School.
Ownership History
Date
Name
Owned For
Owner Type
Purchase Details
Closed on
Aug 23, 2012
Sold by
Hsbc Bank Usa National Association
Bought by
Harrison Rickey and Harrison Julia
Current Estimated Value
Home Financials for this Owner
Home Financials are based on the most recent Mortgage that was taken out on this home.
Original Mortgage
$66,542
Outstanding Balance
$46,119
Interest Rate
3.68%
Mortgage Type
New Conventional
Estimated Equity
$198,457
Purchase Details
Closed on
Apr 10, 2012
Sold by
Harvell Craig and Harvell Anna
Bought by
Hsbc Bank Usa National Association
Purchase Details
Closed on
May 11, 2006
Sold by
Ph & P Development Llc
Bought by
Miskin Mark E and Miskin Renee M
Home Financials for this Owner
Home Financials are based on the most recent Mortgage that was taken out on this home.
Original Mortgage
$156,000
Interest Rate
8.8%
Mortgage Type
Fannie Mae Freddie Mac
Create a Home Valuation Report for This Property
The Home Valuation Report is an in-depth analysis detailing your home's value as well as a comparison with similar homes in the area
Home Values in the Area
Average Home Value in this Area
Purchase History
| Date | Buyer | Sale Price | Title Company |
|---|---|---|---|
| Harrison Rickey | $57,200 | Mitchell Land & Title Inc | |
| Hsbc Bank Usa National Association | $25,100 | Attorney | |
| Miskin Mark E | $195,000 | H & S Title & Escrow Inc |
Source: Public Records
Mortgage History
| Date | Status | Borrower | Loan Amount |
|---|---|---|---|
| Open | Harrison Rickey | $66,542 | |
| Previous Owner | Miskin Mark E | $156,000 |
Source: Public Records
Tax History Compared to Growth
Tax History
| Year | Tax Paid | Tax Assessment Tax Assessment Total Assessment is a certain percentage of the fair market value that is determined by local assessors to be the total taxable value of land and additions on the property. | Land | Improvement |
|---|---|---|---|---|
| 2024 | $608 | $109,530 | -- | -- |
| 2023 | $608 | $106,340 | $0 | $0 |
| 2022 | $639 | $103,243 | $0 | $0 |
| 2021 | $644 | $100,236 | $0 | $0 |
| 2020 | $653 | $99,116 | $6,196 | $92,920 |
| 2019 | $629 | $96,630 | $0 | $0 |
| 2018 | $615 | $94,828 | $0 | $0 |
| 2017 | $621 | $95,220 | $6,075 | $89,145 |
| 2016 | $610 | $93,293 | $0 | $0 |
| 2015 | $617 | $92,956 | $0 | $0 |
| 2014 | $627 | $92,956 | $0 | $0 |
Source: Public Records
Map
Nearby Homes
- 1192 Oakwood Lakes Blvd
- 135 Rembrandt Cir
- 383 W Michaelangelo Rd
- 31 Rembrandt Cir
- 115 Rembrandt Cir
- 444 Donatello Rd
- 93 W Raphael Rd
- 63 E Raphael Rd
- 0 E Picasso Cir
- 714 E Picasso Cir
- TBD Picasso Ln
- TBD Owens Rd
- .62 acre W Renoir Rd
- Lots 4-6 W Renoir Rd
- Lot 5 W Renoir Rd
- LOT 4 W Renoir Rd
- 211 W Renoir Rd
- 000 Commerce Cir
- 585 Huckaba Rd E
- 674 Peacock Rd
- 117 E Michaelangelo Rd
- 113 E Michaelangelo Rd Unit 7
- 295 E Michaelangelo Rd
- 109 E Michaelangelo Rd
- 116 E Michaelangelo Rd
- 89 E Michaelangelo Rd
- Lot 11 E Michaelangleo Ln
- 61 W Michaelangelo Rd
- 106 E Michaelangelo Rd
- 90 E Michaelangelo Rd
- Lot 30 Oakwood Lakes Blvd
- 199 Donatello Rd
- Lot 23 W Michaelangelo Rd
- 63 E Michaelangelo Rd
- 6 Donatello Rd
- 131 Donatello Rd
- LOT 53 Rodin
- 1182 Oakwood Lakes Blvd
- 1170 Oakwood Lakes Blvd
- 1154 Oakwood Lakes Blvd