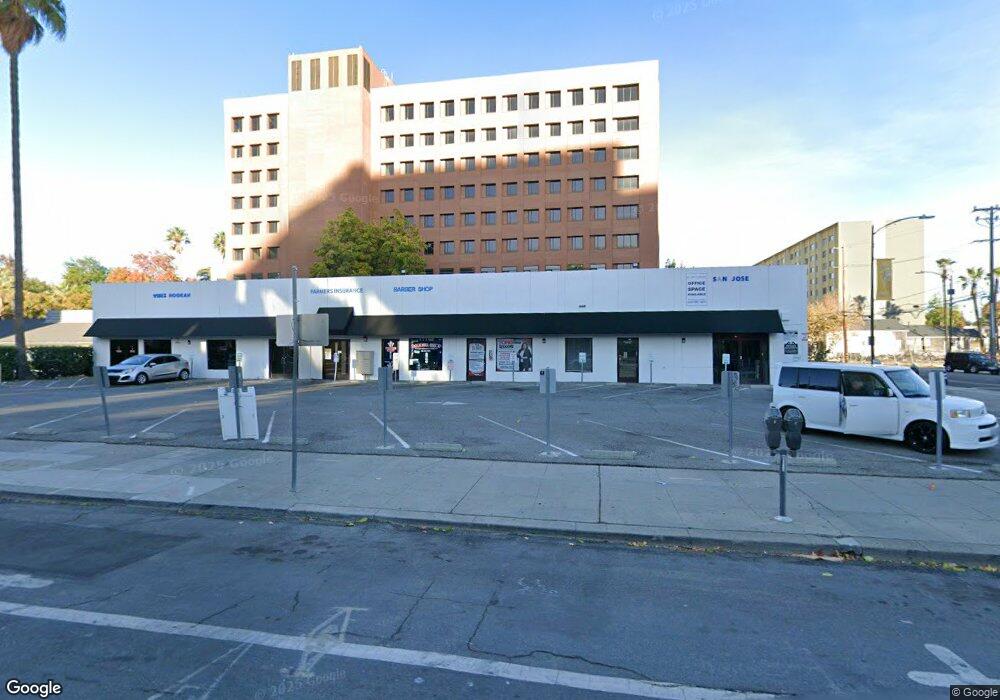
115 N 4th St Unit 107A San Jose, CA 95112
Northside NeighborhoodEstimated Value: $3,028,585
--
Bed
--
Bath
415
Sq Ft
$7,298/Sq Ft
Est. Value
About This Home
This home is located at 115 N 4th St Unit 107A, San Jose, CA 95112 and is currently estimated at $3,028,585, approximately $7,297 per square foot. 115 N 4th St Unit 107A is a home located in Santa Clara County with nearby schools including Horace Mann Elementary School, Muwekma Ohlone Middle, and San Jose High School.
Ownership History
Date
Name
Owned For
Owner Type
Purchase Details
Closed on
Mar 28, 2000
Sold by
Malek Moosa and Maleksalehi Moosa
Bought by
St John Properties Llc
Current Estimated Value
Home Financials for this Owner
Home Financials are based on the most recent Mortgage that was taken out on this home.
Original Mortgage
$1,440,000
Outstanding Balance
$485,221
Interest Rate
8.21%
Mortgage Type
Commercial
Estimated Equity
$2,543,364
Purchase Details
Closed on
Mar 13, 2000
Sold by
Malek Shohreh and Maleksalehi Shohreh
Bought by
Malek Moosa and Maleksalehi Moosa
Home Financials for this Owner
Home Financials are based on the most recent Mortgage that was taken out on this home.
Original Mortgage
$1,440,000
Outstanding Balance
$485,221
Interest Rate
8.21%
Mortgage Type
Commercial
Estimated Equity
$2,543,364
Create a Home Valuation Report for This Property
The Home Valuation Report is an in-depth analysis detailing your home's value as well as a comparison with similar homes in the area
Home Values in the Area
Average Home Value in this Area
Purchase History
| Date | Buyer | Sale Price | Title Company |
|---|---|---|---|
| St John Properties Llc | $809,500 | Alliance Title Company | |
| Malek Moosa | -- | Alliance Title Company | |
| Malek Moosa | $2,030,000 | Alliance Title Company |
Source: Public Records
Mortgage History
| Date | Status | Borrower | Loan Amount |
|---|---|---|---|
| Open | Malek Moosa | $1,440,000 |
Source: Public Records
Tax History Compared to Growth
Tax History
| Year | Tax Paid | Tax Assessment Tax Assessment Total Assessment is a certain percentage of the fair market value that is determined by local assessors to be the total taxable value of land and additions on the property. | Land | Improvement |
|---|---|---|---|---|
| 2025 | $46,849 | $3,623,713 | $2,392,783 | $1,230,930 |
| 2024 | $46,849 | $3,552,661 | $2,345,866 | $1,206,795 |
| 2023 | $46,214 | $3,483,002 | $2,299,869 | $1,183,133 |
| 2022 | $46,018 | $3,414,709 | $2,254,774 | $1,159,935 |
| 2021 | $43,214 | $3,347,755 | $2,210,563 | $1,137,192 |
| 2020 | $42,859 | $3,313,429 | $2,187,897 | $1,125,532 |
| 2019 | $45,208 | $3,248,461 | $2,144,998 | $1,103,463 |
| 2018 | $27,816 | $2,026,203 | $1,756,048 | $270,155 |
| 2017 | $27,684 | $1,986,474 | $1,721,616 | $264,858 |
| 2016 | $27,734 | $1,947,524 | $1,687,859 | $259,665 |
| 2015 | $27,540 | $1,918,271 | $1,662,506 | $255,765 |
| 2014 | $27,638 | $1,880,695 | $1,629,940 | $250,755 |
Source: Public Records
Map
Nearby Homes
- 106 N 5th St
- 97 E Saint James St Unit 51
- 97 E Saint James St Unit 41
- 92 N 6th St
- 25 S 3rd St Unit 103
- 25 S 3rd St Unit 311
- 183 N 7th St
- 121 E Julian St
- 1 1
- 301 N 5th St
- 30 E Julian St Unit 307
- 84 S 5th St
- 1 E Julian St Unit 113
- 130 E San Fernando St Unit 513
- 88 E San Fernando St Unit 804
- 88 E San Fernando St Unit 2103
- 88 E San Fernando St Unit 507
- 88 E San Fernando St Unit 909
- 350 N 2nd St Unit 342
- 144 S 3rd St Unit 132
- 115 N Fouth St Unit 102
- 0 N 3rd St
- 140 N 4th St Unit 4
- 146 N 4th St
- 156 E Saint John St
- 152 N 4th St
- 160 N 4th St
- 167 N 4th St
- 117 N 5th St
- 137 N 5th St
- 145 N 5th St
- 153 N 5th St
- 60 N 3rd St
- 178 E Saint James St
- 187 N 5th St
- 114 N 5th St
- 193 N 5th St Unit C
- 193 N 5th St
- 28 N 4th St Unit W2715
- 28 N 4th St Unit W2714