115 Netas Dr Palm Desert, CA 92260
Estimated Value: $4,614,204 - $5,184,000
3
Beds
4
Baths
5,803
Sq Ft
$848/Sq Ft
Est. Value
About This Home
This home is located at 115 Netas Dr, Palm Desert, CA 92260 and is currently estimated at $4,922,401, approximately $848 per square foot. 115 Netas Dr is a home located in Riverside County with nearby schools including La Quinta Middle School, Palm Desert High School, and George Washington Charter School.
Ownership History
Date
Name
Owned For
Owner Type
Purchase Details
Closed on
Dec 9, 2010
Sold by
Stever James H and Stever Katherine K
Bought by
Hall William K and Hall Valerie W
Current Estimated Value
Purchase Details
Closed on
Jan 2, 1998
Sold by
Stever James H and Stever Katherine K
Bought by
Stever James H and Stever Katherine K
Home Financials for this Owner
Home Financials are based on the most recent Mortgage that was taken out on this home.
Original Mortgage
$1,000,000
Interest Rate
7.25%
Purchase Details
Closed on
May 2, 1996
Sold by
Bighorn Development Lp
Bought by
Stever James H and Stever Katherine K
Home Financials for this Owner
Home Financials are based on the most recent Mortgage that was taken out on this home.
Original Mortgage
$350,000
Interest Rate
8.07%
Purchase Details
Closed on
Jun 22, 1994
Sold by
Krakus Ventures Ltd
Bought by
Desert Communities Inc
Create a Home Valuation Report for This Property
The Home Valuation Report is an in-depth analysis detailing your home's value as well as a comparison with similar homes in the area
Purchase History
| Date | Buyer | Sale Price | Title Company |
|---|---|---|---|
| Hall William K | -- | Fidelity National Title Co | |
| Stever James H | -- | First American Title Ins Co | |
| Stever James H | $600,000 | Stewart Title | |
| Desert Communities Inc | $1,079,500 | Stewart Title Co |
Source: Public Records
Mortgage History
| Date | Status | Borrower | Loan Amount |
|---|---|---|---|
| Previous Owner | Stever James H | $1,000,000 | |
| Previous Owner | Stever James H | $350,000 |
Source: Public Records
Tax History
| Year | Tax Paid | Tax Assessment Tax Assessment Total Assessment is a certain percentage of the fair market value that is determined by local assessors to be the total taxable value of land and additions on the property. | Land | Improvement |
|---|---|---|---|---|
| 2025 | $47,369 | $3,907,580 | $1,665,525 | $2,242,055 |
| 2023 | $47,369 | $3,755,846 | $1,600,851 | $2,154,995 |
| 2022 | $45,491 | $3,682,203 | $1,569,462 | $2,112,741 |
| 2021 | $44,584 | $3,610,004 | $1,538,689 | $2,071,315 |
| 2020 | $43,733 | $3,572,989 | $1,522,912 | $2,050,077 |
| 2019 | $42,892 | $3,502,931 | $1,493,051 | $2,009,880 |
| 2018 | $42,068 | $3,434,247 | $1,463,777 | $1,970,470 |
| 2017 | $41,209 | $3,366,910 | $1,435,076 | $1,931,834 |
| 2016 | $40,193 | $3,300,893 | $1,406,938 | $1,893,955 |
| 2015 | $40,362 | $3,251,312 | $1,385,805 | $1,865,507 |
| 2014 | $39,676 | $3,187,625 | $1,358,660 | $1,828,965 |
Source: Public Records
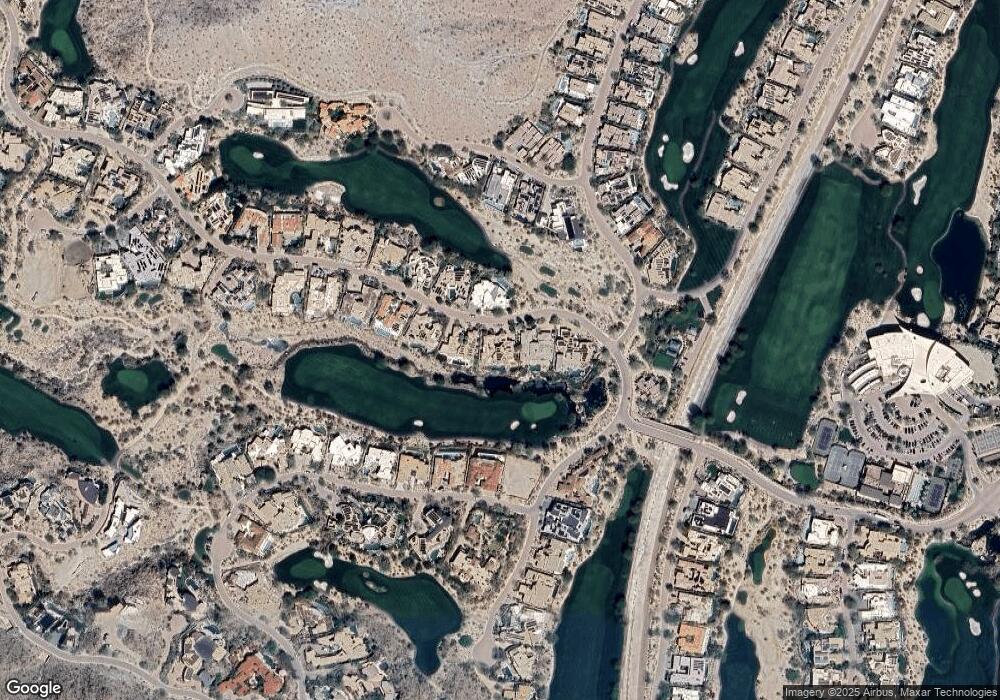
Map
Nearby Homes
- 130 Wanish Place
- 136 Netas Dr
- 113 Metate Place
- 101 Netas Ct
- 137 Metate Place
- 245 Kiva Ct
- 294 Metate Place
- 312 Metate Place
- 173 Tamit Place
- 330 Metate Place
- 542 Mesquite Hills
- 71771 Jaguar Way
- 0 Jaguar Way & Kit Fox Rd
- 1 Running H
- 71475 Jaguar Way
- 20 Ocotillo Ln
- 11 Ocotillo Ln
- 50 Country Club Dr
- 71411 Cholla Way
- 25 Pampas Ln
Your Personal Tour Guide
Ask me questions while you tour the home.