115 Peach St Athens, TN 37303
Estimated Value: $164,000 - $260,000
--
Bed
2
Baths
1,200
Sq Ft
$178/Sq Ft
Est. Value
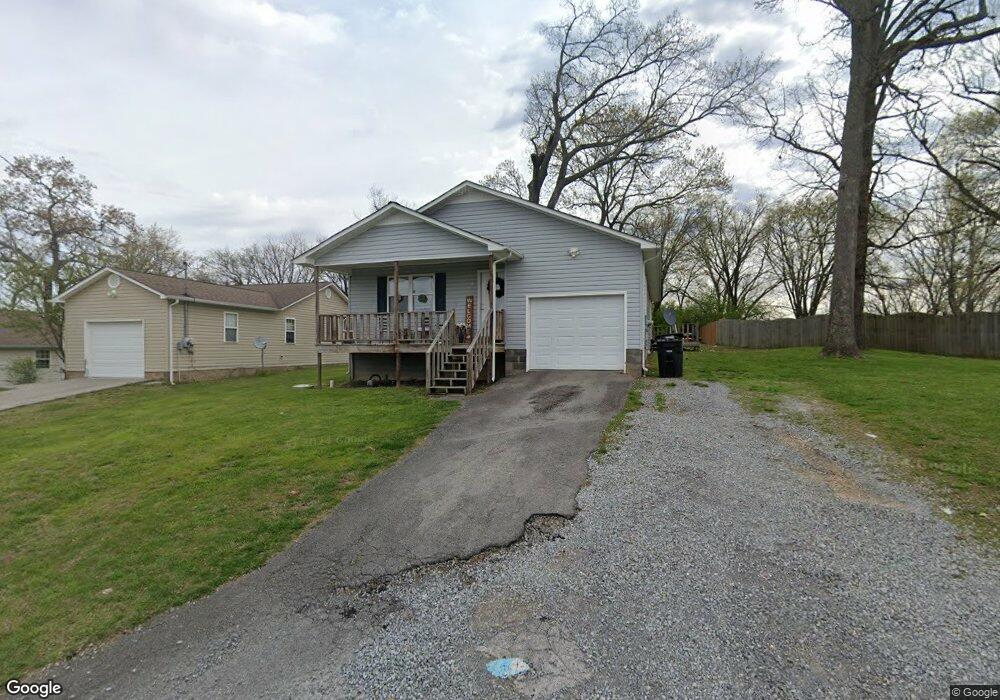
About This Home
This home is located at 115 Peach St, Athens, TN 37303 and is currently estimated at $213,652, approximately $178 per square foot. 115 Peach St is a home located in McMinn County with nearby schools including Ingleside Elementary School, City Park Elementary School, and North City Elementary School.
Ownership History
Date
Name
Owned For
Owner Type
Purchase Details
Closed on
Apr 23, 2021
Sold by
Dennis William Scott
Bought by
Dennis Sharon Ann
Current Estimated Value
Purchase Details
Closed on
Oct 28, 2013
Sold by
United States Of America
Bought by
Dennis William Scott
Purchase Details
Closed on
Apr 30, 2013
Sold by
Robin Melanie
Bought by
United States Of America
Purchase Details
Closed on
Aug 18, 2004
Sold by
Levine Russell
Bought by
Robin Melanie J
Home Financials for this Owner
Home Financials are based on the most recent Mortgage that was taken out on this home.
Original Mortgage
$84,450
Interest Rate
5.97%
Create a Home Valuation Report for This Property
The Home Valuation Report is an in-depth analysis detailing your home's value as well as a comparison with similar homes in the area
Home Values in the Area
Average Home Value in this Area
Purchase History
| Date | Buyer | Sale Price | Title Company |
|---|---|---|---|
| Dennis Sharon Ann | -- | Title Insurance Company | |
| Dennis William Scott | $47,000 | -- | |
| United States Of America | $45,606 | -- | |
| Robin Melanie J | $82,500 | -- |
Source: Public Records
Mortgage History
| Date | Status | Borrower | Loan Amount |
|---|---|---|---|
| Previous Owner | Robin Melanie J | $84,450 |
Source: Public Records
Tax History Compared to Growth
Tax History
| Year | Tax Paid | Tax Assessment Tax Assessment Total Assessment is a certain percentage of the fair market value that is determined by local assessors to be the total taxable value of land and additions on the property. | Land | Improvement |
|---|---|---|---|---|
| 2024 | $840 | $40,150 | $5,050 | $35,100 |
| 2023 | $844 | $40,150 | $5,050 | $35,100 |
| 2022 | $797 | $27,525 | $4,100 | $23,425 |
| 2021 | $797 | $27,525 | $4,100 | $23,425 |
| 2020 | $775 | $27,525 | $4,100 | $23,425 |
| 2019 | $775 | $27,525 | $4,100 | $23,425 |
| 2018 | $775 | $27,525 | $4,100 | $23,425 |
| 2017 | $767 | $25,725 | $1,975 | $23,750 |
| 2016 | $767 | $25,725 | $1,975 | $23,750 |
| 2015 | -- | $25,725 | $1,975 | $23,750 |
| 2014 | $707 | $25,721 | $0 | $0 |
Source: Public Records
Map
Nearby Homes