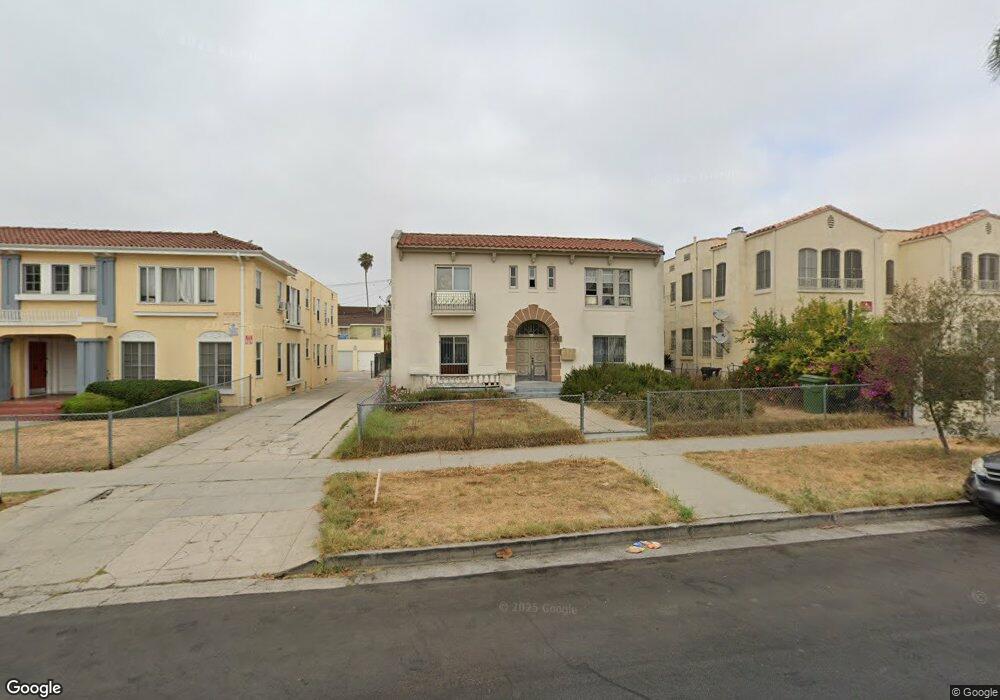
115 S Berendo St Unit 2 Los Angeles, CA 90004
Koreatown NeighborhoodEstimated Value: $1,461,000 - $2,142,000
4
Beds
4
Baths
4,340
Sq Ft
$399/Sq Ft
Est. Value
About This Home
This home is located at 115 S Berendo St Unit 2, Los Angeles, CA 90004 and is currently estimated at $1,732,977, approximately $399 per square foot. 115 S Berendo St Unit 2 is a home located in Los Angeles County with nearby schools including Frank Del Olmo Elementary School, Virgil Middle School, and Belmont High School.
Ownership History
Date
Name
Owned For
Owner Type
Purchase Details
Closed on
Jun 11, 1999
Sold by
Park Sung Chin
Bought by
Park Sung Chin
Current Estimated Value
Purchase Details
Closed on
Mar 25, 1996
Sold by
Park Young Joon
Bought by
Park Hea Ja
Home Financials for this Owner
Home Financials are based on the most recent Mortgage that was taken out on this home.
Original Mortgage
$132,800
Interest Rate
6.98%
Purchase Details
Closed on
Feb 28, 1996
Sold by
Federal Home Loan Mortgage Corporation
Bought by
Park Sung Chin and Park Hea Ja
Home Financials for this Owner
Home Financials are based on the most recent Mortgage that was taken out on this home.
Original Mortgage
$132,800
Interest Rate
6.98%
Purchase Details
Closed on
Nov 1, 1995
Sold by
Yu Duck Soon and Federal Home Loan Mortgage Cor
Bought by
Federal Home Loan Mortgage Corporation
Create a Home Valuation Report for This Property
The Home Valuation Report is an in-depth analysis detailing your home's value as well as a comparison with similar homes in the area
Home Values in the Area
Average Home Value in this Area
Purchase History
| Date | Buyer | Sale Price | Title Company |
|---|---|---|---|
| Park Sung Chin | -- | -- | |
| Park Hea Ja | -- | First American Title Co | |
| Park Sung Chin | $166,000 | First American Title Co | |
| Federal Home Loan Mortgage Corporation | $200,000 | Chicago Title Co |
Source: Public Records
Mortgage History
| Date | Status | Borrower | Loan Amount |
|---|---|---|---|
| Previous Owner | Park Sung Chin | $132,800 |
Source: Public Records
Tax History Compared to Growth
Tax History
| Year | Tax Paid | Tax Assessment Tax Assessment Total Assessment is a certain percentage of the fair market value that is determined by local assessors to be the total taxable value of land and additions on the property. | Land | Improvement |
|---|---|---|---|---|
| 2025 | $3,938 | $275,736 | $227,578 | $48,158 |
| 2024 | $3,938 | $270,330 | $223,116 | $47,214 |
| 2023 | $3,877 | $265,031 | $218,742 | $46,289 |
| 2022 | $3,725 | $259,835 | $214,453 | $45,382 |
| 2021 | $3,654 | $254,742 | $210,249 | $44,493 |
| 2019 | $3,559 | $247,688 | $204,014 | $43,674 |
| 2018 | $3,345 | $242,842 | $200,014 | $42,828 |
| 2017 | $3,282 | $237,592 | $196,093 | $41,499 |
| 2016 | $3,158 | $232,935 | $192,249 | $40,686 |
| 2015 | $3,117 | $229,437 | $189,362 | $40,075 |
| 2014 | $3,155 | $224,943 | $185,653 | $39,290 |
Source: Public Records
Map
Nearby Homes
- 144 S Catalina St
- 125 S New Hampshire Ave
- 120 N Berendo St
- 121 N New Hampshire Ave
- 211 S Berendo St Unit 3
- 147 N Berendo St Unit 202
- 62 N Edgemont St
- 162 N Kenmore Ave Unit 103
- 210 N Berendo St
- 250 S Kenmore Ave
- 130 S Alexandria Ave
- 226 N Catalina St
- 158 N Edgemont St
- 236 N Catalina St
- 105 S Mariposa Ave Unit PH9
- 101 S Mariposa Ave
- 310 N Kenmore Ave
- 360 S Kenmore Ave Unit 302
- 360 S Kenmore Ave Unit 209
- 240 S Normandie Ave
- 121 S Berendo St
- 109 S Berendo St Unit 4
- 109 S Berendo St Unit 3
- 109 S Berendo St
- 129 S Berendo St Unit 1/2
- 127 S Berendo St
- 114 S Catalina St
- 108 S Catalina St
- 3754 W 1st St Unit 3756
- 3754 W 1st St
- 133 S Berendo St
- 120 S Catalina St
- 120 S Catalina St Unit 120 s Catalina stree
- 116 S Berendo St Unit 2
- 116 S Berendo St
- 108 S Berendo St
- 130 S Catalina St
- 122 S Berendo St
- 130 S Berendo St
- 138 S Catalina St Unit 138