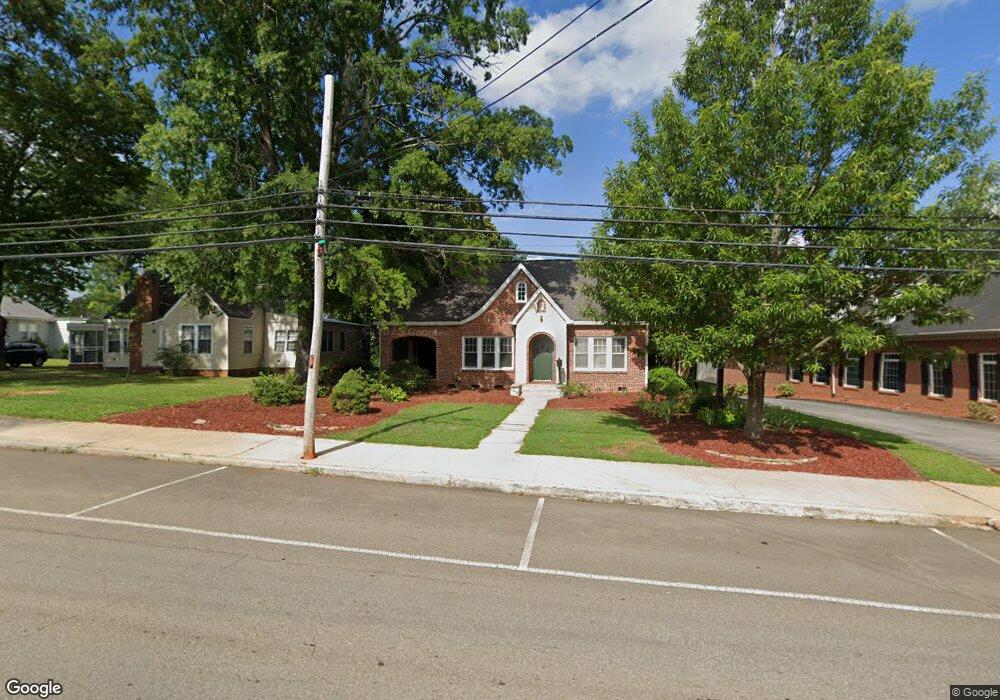
115 S Main St Unit 2 Jasper, GA 30143
Estimated Value: $567,164
Studio
--
Bath
1,560
Sq Ft
$364/Sq Ft
Est. Value
About This Home
This home is located at 115 S Main St Unit 2, Jasper, GA 30143 and is currently estimated at $567,164, approximately $363 per square foot. 115 S Main St Unit 2 is a home located in Pickens County with nearby schools including Harmony Elementary School, Pickens County Middle School, and Pickens County High School.
Ownership History
Date
Name
Owned For
Owner Type
Purchase Details
Closed on
Apr 17, 2018
Sold by
Independent Wealth Tbci Gr
Bought by
Shanekelly Llc
Current Estimated Value
Home Financials for this Owner
Home Financials are based on the most recent Mortgage that was taken out on this home.
Original Mortgage
$240,000
Interest Rate
4.45%
Mortgage Type
New Conventional
Purchase Details
Closed on
Sep 11, 2014
Sold by
Jorns Property Management
Bought by
Independent Wealth Tbci Grp Ll
Home Financials for this Owner
Home Financials are based on the most recent Mortgage that was taken out on this home.
Original Mortgage
$450,000
Interest Rate
4.17%
Mortgage Type
Commercial
Purchase Details
Closed on
Jul 12, 2005
Sold by
Clark Heather P
Bought by
Jorns Property Management Llc
Purchase Details
Closed on
May 31, 2002
Sold by
New Russell W
Bought by
Clark Heather P
Purchase Details
Closed on
Jun 15, 2000
Sold by
Dean Amanda E
Bought by
New Russell W
Purchase Details
Closed on
Jun 1, 1998
Sold by
Williams Williams R and Williams E
Bought by
Dean Amanda E
Create a Home Valuation Report for This Property
The Home Valuation Report is an in-depth analysis detailing your home's value as well as a comparison with similar homes in the area
Home Values in the Area
Average Home Value in this Area
Purchase History
| Date | Buyer | Sale Price | Title Company |
|---|---|---|---|
| Shanekelly Llc | $300,000 | -- | |
| Independent Wealth Tbci Grp Ll | $221,675 | -- | |
| Jorns Property Management Llc | $240,000 | -- | |
| Clark Heather P | $195,000 | -- | |
| New Russell W | $175,000 | -- | |
| Dean Amanda E | $105,000 | -- |
Source: Public Records
Mortgage History
| Date | Status | Borrower | Loan Amount |
|---|---|---|---|
| Closed | Shanekelly Llc | $240,000 | |
| Closed | Shanekelly Llc | $50,696 | |
| Previous Owner | Independent Wealth Tbci Grp Ll | $450,000 |
Source: Public Records
Tax History
| Year | Tax Paid | Tax Assessment Tax Assessment Total Assessment is a certain percentage of the fair market value that is determined by local assessors to be the total taxable value of land and additions on the property. | Land | Improvement |
|---|---|---|---|---|
| 2025 | $3,189 | $128,430 | $33,721 | $94,709 |
| 2024 | $3,077 | $120,939 | $33,721 | $87,218 |
| 2023 | $3,144 | $120,939 | $33,721 | $87,218 |
| 2022 | $2,460 | $120,939 | $33,721 | $87,218 |
| 2021 | $2,271 | $104,239 | $28,101 | $76,138 |
| 2020 | $2,339 | $104,239 | $28,101 | $76,138 |
| 2019 | $2,393 | $104,239 | $28,101 | $76,138 |
| 2018 | $2,380 | $102,692 | $28,101 | $74,591 |
| 2017 | $2,169 | $92,072 | $28,101 | $63,971 |
Source: Public Records
Map
Nearby Homes
- 365 Summit View Ln
- 288 Blazingstar Trail
- 0 Black Hawk Place Lot 242 Unit 7715035
- 0 Black Hawk Place Lot 242 Unit 10686039
- 365 Summit View Ln Unit 6
- TBD Cowart Mountain Tract 3 Rd
- 8266 Cox Mountain Dr
- 80 Jones St
- 87 Jones St
- 172 Jacobs Way Unit A,B,C,D
- 172 Jacobs Way
- 597 S Main St
- 190 Towne Villas Dr
- 5566 Red Fox Ln
- 0 Hunters Ridge Rd Unit 7714906
- 2668 Highland Trail
- 5574 Red Fox Ln
- 80 Mountain Mint Dr
- 0 Hunters Ridge Rd Unit 10685847
- 280 Vistaview Pkwy
- 115 S Main St
- 103 S Main St
- 81 S Main St
- 147 S Main St
- 120 S Main St
- 69 S Main St
- 80 S Main St
- 175 S Main St
- 72 S Main St
- 0 Mineral Springs Rd N
- 0 Mineral Springs Rd N Unit 7468098
- 0 Mineral Springs Rd N Unit 7564682
- 0 Mineral Springs Rd N Unit 7393412
- 0 Mineral Springs Rd N Unit 7340791
- 0 Mineral Springs Rd N Unit 3090316
- 0 Mineral Springs Rd N Unit 3264949
- 0 Mineral Springs Rd N Unit 7470409
- 164 S Main St
- 42 &44 Circle Stone Rd
- 1529 S 15-29 S Main St Unit 3 St Unit 3
Your Personal Tour Guide
Ask me questions while you tour the home.