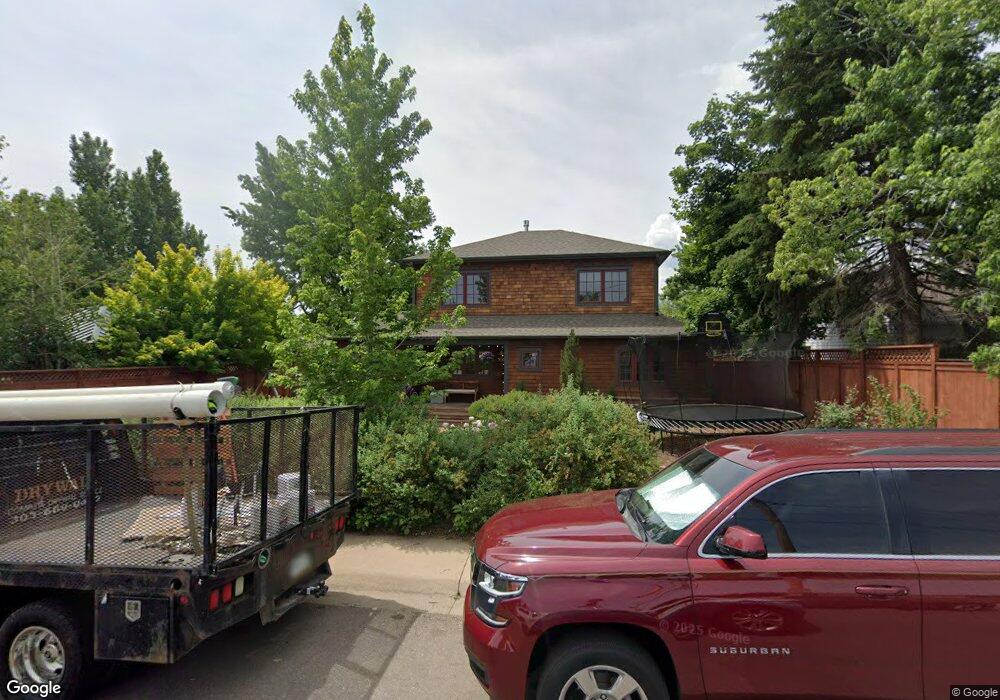
1150 Hawthorn Ave Boulder, CO 80304
Newlands NeighborhoodEstimated Value: $2,082,000 - $2,218,000
3
Beds
2
Baths
2,377
Sq Ft
$904/Sq Ft
Est. Value
About This Home
This home is located at 1150 Hawthorn Ave, Boulder, CO 80304 and is currently estimated at $2,149,082, approximately $904 per square foot. 1150 Hawthorn Ave is a home located in Boulder County with nearby schools including Foothill Elementary School, Casey Middle School, and Boulder High School.
Ownership History
Date
Name
Owned For
Owner Type
Purchase Details
Closed on
Jun 6, 2011
Sold by
Stevenson Patricia L
Bought by
Downey Elizabeth L
Current Estimated Value
Home Financials for this Owner
Home Financials are based on the most recent Mortgage that was taken out on this home.
Original Mortgage
$850,000
Interest Rate
0.46%
Mortgage Type
Purchase Money Mortgage
Purchase Details
Closed on
Jan 31, 2001
Sold by
Roberts Clara M and Estate Of Nancy M Moschetti
Bought by
Stevenson Patricia L
Home Financials for this Owner
Home Financials are based on the most recent Mortgage that was taken out on this home.
Original Mortgage
$360,000
Interest Rate
7.5%
Purchase Details
Closed on
Aug 14, 1980
Bought by
Downey Elizabeth L and Silberstein Joshua D
Purchase Details
Closed on
Jun 29, 1962
Bought by
Downey Elizabeth L and Silberstein Joshua D
Create a Home Valuation Report for This Property
The Home Valuation Report is an in-depth analysis detailing your home's value as well as a comparison with similar homes in the area
Home Values in the Area
Average Home Value in this Area
Purchase History
| Date | Buyer | Sale Price | Title Company |
|---|---|---|---|
| Downey Elizabeth L | $795,000 | Heritage Title | |
| Stevenson Patricia L | $450,000 | -- | |
| Downey Elizabeth L | $79,500 | -- | |
| Downey Elizabeth L | $15,000 | -- |
Source: Public Records
Mortgage History
| Date | Status | Borrower | Loan Amount |
|---|---|---|---|
| Previous Owner | Downey Elizabeth L | $850,000 | |
| Previous Owner | Stevenson Patricia L | $360,000 |
Source: Public Records
Tax History Compared to Growth
Tax History
| Year | Tax Paid | Tax Assessment Tax Assessment Total Assessment is a certain percentage of the fair market value that is determined by local assessors to be the total taxable value of land and additions on the property. | Land | Improvement |
|---|---|---|---|---|
| 2025 | $12,755 | $134,569 | $104,781 | $29,788 |
| 2024 | $12,755 | $134,569 | $104,781 | $29,788 |
| 2023 | $12,533 | $145,129 | $114,356 | $34,458 |
| 2022 | $10,437 | $112,388 | $82,524 | $29,864 |
| 2021 | $9,952 | $115,623 | $84,899 | $30,724 |
| 2020 | $8,475 | $97,369 | $76,005 | $21,364 |
| 2019 | $8,346 | $97,369 | $76,005 | $21,364 |
| 2018 | $8,021 | $92,520 | $60,984 | $31,536 |
| 2017 | $6,640 | $87,401 | $67,421 | $19,980 |
| 2016 | $6,411 | $74,060 | $49,591 | $24,469 |
| 2015 | $6,071 | $56,683 | $31,283 | $25,400 |
| 2014 | $4,766 | $56,683 | $31,283 | $25,400 |
Source: Public Records
Map
Nearby Homes
- 3315 Broadway St
- 3319 Broadway
- 1023 Forest Ave
- 1172 Juniper Ave
- 1070 Juniper Ave
- 864 Iris Ave
- 3135 11th St
- 1127 Juniper Ave
- 711 Hawthorn Ave
- 910 Kalmia Ave
- 640 Iris Ave
- 1400 Kalmia Ave
- 706 Juniper Ave
- 1237 Elder Ave Unit 1
- 800 Kalmia Ave
- 3025 Broadway St Unit 7
- 560 Iris Ave
- 855 Kalmia Ave
- 550 Iris Ave
- 3056 8th St
- 1080 Hawthorn Ave
- 1180 Hawthorn Ave
- 1125 Grape Ave
- 1105 Grape Ave
- 1050 Hawthorn Ave
- 1145 Grape Ave
- 1085 Grape Ave
- 1190 Hawthorn Ave
- 3241 Broadway St
- 1065 Grape Ave
- 1032 Hawthorn Ave
- 1165 Grape Ave
- 1045 Grape Ave
- 1012 Hawthorn Ave
- 3250 11th St
- 1025 Grape Ave
- 3251 11th St
- 1000 Hawthorn Ave
- 3303 Broadway
- 3237 Broadway St