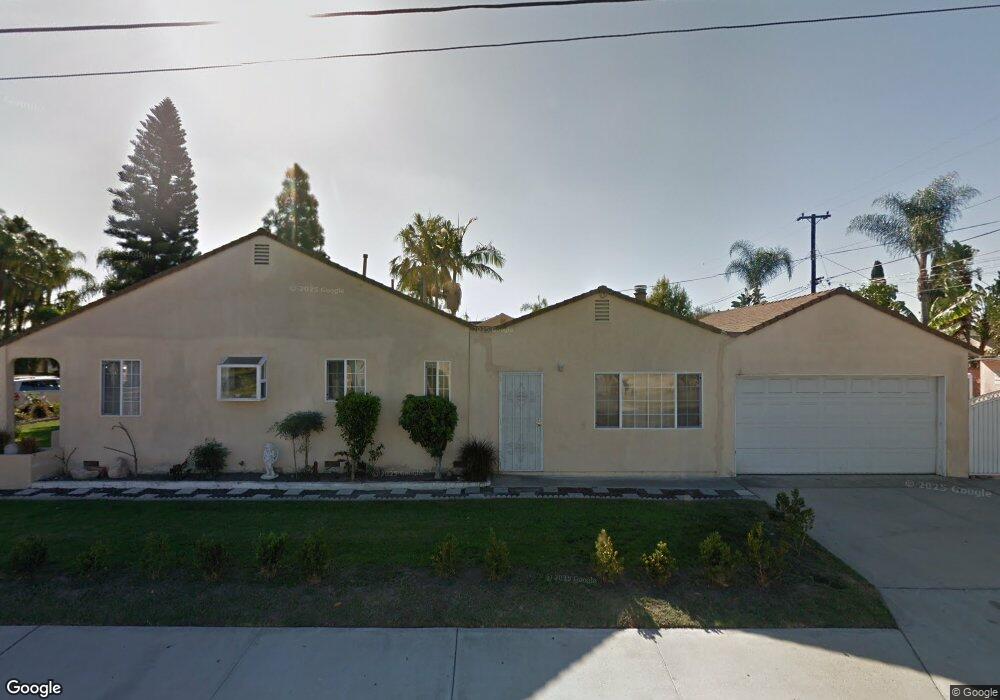
11501 Morgan Ln Garden Grove, CA 92840
Estimated Value: $999,000 - $1,281,000
4
Beds
3
Baths
2,045
Sq Ft
$557/Sq Ft
Est. Value
About This Home
This home is located at 11501 Morgan Ln, Garden Grove, CA 92840 and is currently estimated at $1,138,175, approximately $556 per square foot. 11501 Morgan Ln is a home located in Orange County with nearby schools including Parkview Elementary, Lake Intermediate School, and Garden Grove High School.
Ownership History
Date
Name
Owned For
Owner Type
Purchase Details
Closed on
Apr 1, 2017
Sold by
Luafau Peretiso and Luafau Malta
Bought by
Luafau Peretiso Mataiumu and Luafau Malta Nive
Current Estimated Value
Purchase Details
Closed on
Aug 16, 2000
Sold by
Alan Pham and Alan Hoa H
Bought by
Luafau Peretiso and Luafau Malia
Home Financials for this Owner
Home Financials are based on the most recent Mortgage that was taken out on this home.
Original Mortgage
$222,168
Outstanding Balance
$80,442
Interest Rate
8.2%
Mortgage Type
FHA
Estimated Equity
$1,057,733
Purchase Details
Closed on
Jun 11, 1998
Sold by
Breneman Aileen R and Breneman Aileen R
Bought by
Pham Alan Phu and Nguyen Hoa H
Home Financials for this Owner
Home Financials are based on the most recent Mortgage that was taken out on this home.
Original Mortgage
$137,600
Interest Rate
7.03%
Create a Home Valuation Report for This Property
The Home Valuation Report is an in-depth analysis detailing your home's value as well as a comparison with similar homes in the area
Home Values in the Area
Average Home Value in this Area
Purchase History
| Date | Buyer | Sale Price | Title Company |
|---|---|---|---|
| Luafau Peretiso Mataiumu | -- | None Available | |
| Luafau Peretiso | $224,000 | Lawyers Title Company | |
| Pham Alan Phu | $172,000 | Lawyers Title Company | |
| Siwiecki Aileen R | -- | Lawyers Title Company |
Source: Public Records
Mortgage History
| Date | Status | Borrower | Loan Amount |
|---|---|---|---|
| Open | Luafau Peretiso | $222,168 | |
| Previous Owner | Pham Alan Phu | $137,600 |
Source: Public Records
Tax History Compared to Growth
Tax History
| Year | Tax Paid | Tax Assessment Tax Assessment Total Assessment is a certain percentage of the fair market value that is determined by local assessors to be the total taxable value of land and additions on the property. | Land | Improvement |
|---|---|---|---|---|
| 2025 | $4,933 | $391,670 | $263,949 | $127,721 |
| 2024 | $4,933 | $383,991 | $258,774 | $125,217 |
| 2023 | $4,841 | $376,462 | $253,700 | $122,762 |
| 2022 | $4,732 | $369,081 | $248,726 | $120,355 |
| 2021 | $4,665 | $361,845 | $243,849 | $117,996 |
| 2020 | $4,609 | $358,135 | $241,348 | $116,787 |
| 2019 | $4,546 | $351,113 | $236,615 | $114,498 |
| 2018 | $4,435 | $344,229 | $231,976 | $112,253 |
| 2017 | $4,387 | $337,480 | $227,428 | $110,052 |
| 2016 | $4,170 | $330,863 | $222,968 | $107,895 |
| 2015 | $4,115 | $325,894 | $219,619 | $106,275 |
| 2014 | $4,019 | $319,511 | $215,317 | $104,194 |
Source: Public Records
Map
Nearby Homes
- 11531 Kathy Ln
- 11531 West St
- 11402 Morgan Ln
- 11401 Kathy Ln
- 11341 Jacalene Ln
- 827 W Orangewood Ave
- 1913 S Norma Ln
- 11552 9th St
- 11731 Rose Dr
- 405 13181 Lampson
- 1828 S Ninth St
- 2227 S Atlanta St
- 2134 S Acama St
- 2115 1/2 S Broden St
- 2115 S Broden St
- 11841 Shetland Rd
- 2154 S Madrid St
- 12246 Nadine Cir
- 335 W Summerfield Cir Unit 6
- 11252 Chapman Ave
- 11521 Morgan Ln
- 11502 Kathy Ln
- 11531 Morgan Ln
- 11471 Morgan Ln
- 11522 Kathy Ln
- 11502 Morgan Ln
- 11532 Kathy Ln
- 11472 Kathy Ln
- 11522 Morgan Ln
- 11541 Morgan Ln
- 11461 Morgan Ln
- 11532 Morgan Ln
- 11472 Morgan Ln
- 11542 Kathy Ln
- 11462 Kathy Ln
- 11551 Morgan Ln
- 11441 Morgan Ln
- 11462 Morgan Ln
- 11552 Kathy Ln
- 11442 Kathy Ln