1152 Oregonia Rd Lebanon, OH 45036
Turtlecreek Township NeighborhoodEstimated Value: $186,274
2
Beds
1
Bath
1,548
Sq Ft
$120/Sq Ft
Est. Value
About This Home
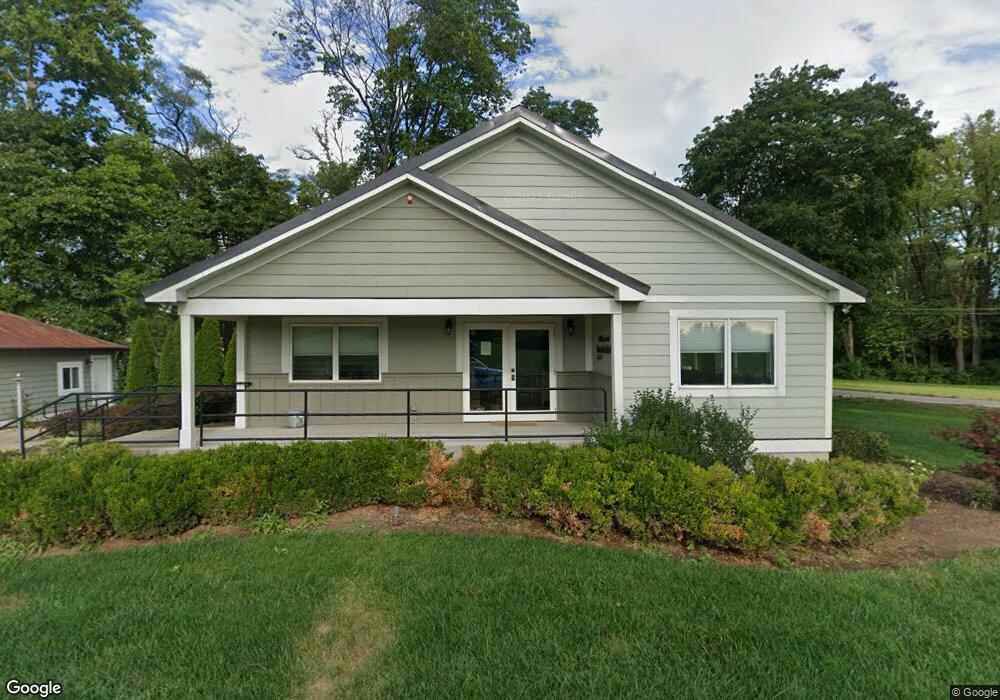
This home is located at 1152 Oregonia Rd, Lebanon, OH 45036 and is currently estimated at $186,274, approximately $120 per square foot. 1152 Oregonia Rd is a home located in Warren County with nearby schools including Bowman Primary School, Berry Intermediate School, and Donovan Elementary School.
Ownership History
Date
Name
Owned For
Owner Type
Purchase Details
Closed on
Nov 20, 2018
Sold by
Turtlecreek Holdings Inc
Bought by
Turtlecreek Holdings Llc
Current Estimated Value
Purchase Details
Closed on
Oct 16, 2014
Sold by
Versamedical Llc
Bought by
Turtlecreek Holdings Inc
Purchase Details
Closed on
May 23, 2014
Sold by
Wells Herbert L and Wells Christine M
Bought by
Versamedical Llc
Home Financials for this Owner
Home Financials are based on the most recent Mortgage that was taken out on this home.
Original Mortgage
$60,000
Interest Rate
4.28%
Mortgage Type
Commercial
Purchase Details
Closed on
Sep 3, 1993
Sold by
Bachman Bachman and Bachman Joan L
Bought by
Herbert Wells and Herbert L.
Purchase Details
Closed on
Mar 19, 1993
Sold by
Bachmann William E and Bachmann William E
Bought by
Bachman and Bachman Joan L
Purchase Details
Closed on
Nov 12, 1982
Sold by
Anderson Anderson and Anderson Vauda Lee
Create a Home Valuation Report for This Property
The Home Valuation Report is an in-depth analysis detailing your home's value as well as a comparison with similar homes in the area
Home Values in the Area
Average Home Value in this Area
Purchase History
| Date | Buyer | Sale Price | Title Company |
|---|---|---|---|
| Turtlecreek Holdings Llc | -- | None Available | |
| Turtlecreek Holdings Inc | -- | None Available | |
| Versamedical Llc | $85,000 | None Available | |
| Herbert Wells | $80,000 | -- | |
| Bachman | -- | -- | |
| -- | $25,000 | -- |
Source: Public Records
Mortgage History
| Date | Status | Borrower | Loan Amount |
|---|---|---|---|
| Previous Owner | Versamedical Llc | $60,000 |
Source: Public Records
Tax History Compared to Growth
Tax History
| Year | Tax Paid | Tax Assessment Tax Assessment Total Assessment is a certain percentage of the fair market value that is determined by local assessors to be the total taxable value of land and additions on the property. | Land | Improvement |
|---|---|---|---|---|
| 2024 | $2,390 | $49,710 | $10,160 | $39,550 |
| 2023 | $2,079 | $38,741 | $10,160 | $28,581 |
| 2022 | $2,074 | $38,742 | $10,161 | $28,581 |
| 2021 | $1,947 | $38,742 | $10,161 | $28,581 |
| 2020 | $2,237 | $38,742 | $10,161 | $28,581 |
| 2019 | $2,255 | $38,742 | $10,161 | $28,581 |
| 2018 | $2,073 | $38,742 | $10,161 | $28,581 |
| 2017 | $2,161 | $38,203 | $10,161 | $28,042 |
| 2016 | $2,224 | $38,203 | $10,161 | $28,042 |
| 2015 | $861 | $29,456 | $10,161 | $19,296 |
| 2014 | $1,711 | $29,460 | $10,160 | $19,300 |
| 2013 | $2,072 | $35,600 | $10,160 | $25,440 |
Source: Public Records
Map
Nearby Homes
- 0 Wilmington Rd Unit 1850287
- 0 Wilmington Rd Unit 940450
- 1538 Oregonia Rd
- 941 Dillon Way
- 355 Summit St
- 781 Shadow Wood Dr
- B Nelson Ln
- 809 Southline Dr
- 850 Sand Trap Place
- 538 Lookout Ridge Dr
- 513 E Warren St
- 111 Ridge Rd
- 16 Mound St
- 954 Southline Dr
- 4377 Waters Edge Ln
- 440 E Main St
- 417 E Warren St
- 324 E Warren St
- 441 Bethpage Way
- 429 Bethpage Way
- 1073 Oregonia Rd
- 1217 Oregonia Rd
- 1063 Oregonia Rd
- 1033 Oregonia Rd
- 1124 Wilmington Rd
- 1004 Oregonia Rd
- 107 Oregonia Rd
- 383 Harbor Dr
- 383 Harbor Dr Unit 11
- 1206 Wilmington Rd
- 388 Ridgewood Ln
- 390 Ridgewood Ln
- 1240 Wilmington Rd
- 1358 Oregonia Rd
- 317 Summit St
- 319 Summit St
- 315 Summit St
- 393 Ridgewood Ln
- 321 Summit St
- 1175 Wilmington Rd