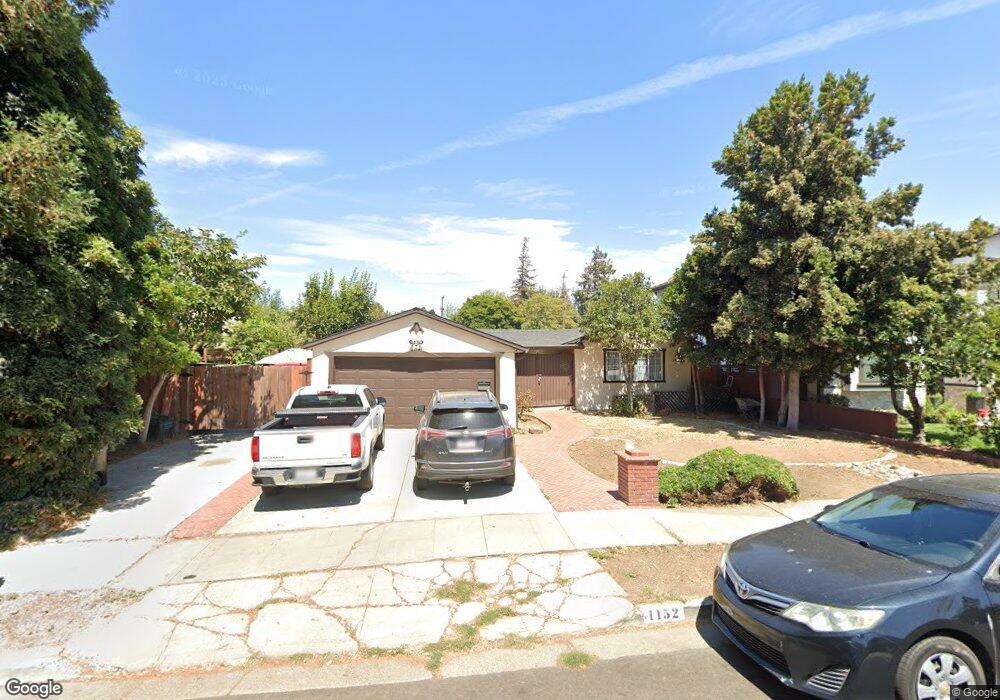
1152 Prevost St San Jose, CA 95125
Willow Glen NeighborhoodEstimated Value: $1,447,000 - $2,053,000
3
Beds
1
Bath
1,404
Sq Ft
$1,155/Sq Ft
Est. Value
About This Home
This home is located at 1152 Prevost St, San Jose, CA 95125 and is currently estimated at $1,621,529, approximately $1,154 per square foot. 1152 Prevost St is a home located in Santa Clara County with nearby schools including Willow Glen Elementary, Willow Glen Middle, and Willow Glen High School.
Ownership History
Date
Name
Owned For
Owner Type
Purchase Details
Closed on
Mar 5, 2004
Sold by
Phan Ngoc
Bought by
Nevarez Heriberto
Current Estimated Value
Home Financials for this Owner
Home Financials are based on the most recent Mortgage that was taken out on this home.
Original Mortgage
$400,000
Outstanding Balance
$176,415
Interest Rate
4.87%
Mortgage Type
Purchase Money Mortgage
Estimated Equity
$1,445,114
Purchase Details
Closed on
Jan 23, 2002
Sold by
Mrowczynski Patrick
Bought by
Phan Ngoc and Mrowczynski Patrick
Purchase Details
Closed on
Sep 15, 1994
Sold by
Langone Caterina and Langone Catherine
Bought by
Mrowczynski Patrick
Home Financials for this Owner
Home Financials are based on the most recent Mortgage that was taken out on this home.
Original Mortgage
$140,800
Interest Rate
8.37%
Create a Home Valuation Report for This Property
The Home Valuation Report is an in-depth analysis detailing your home's value as well as a comparison with similar homes in the area
Home Values in the Area
Average Home Value in this Area
Purchase History
| Date | Buyer | Sale Price | Title Company |
|---|---|---|---|
| Nevarez Heriberto | $549,000 | New Century Title Company | |
| Phan Ngoc | -- | -- | |
| Mrowczynski Patrick | $167,000 | Stewart Title |
Source: Public Records
Mortgage History
| Date | Status | Borrower | Loan Amount |
|---|---|---|---|
| Open | Nevarez Heriberto | $400,000 | |
| Previous Owner | Mrowczynski Patrick | $140,800 | |
| Closed | Nevarez Heriberto | $94,820 |
Source: Public Records
Tax History
| Year | Tax Paid | Tax Assessment Tax Assessment Total Assessment is a certain percentage of the fair market value that is determined by local assessors to be the total taxable value of land and additions on the property. | Land | Improvement |
|---|---|---|---|---|
| 2025 | $11,010 | $780,548 | $546,387 | $234,161 |
| 2024 | $11,010 | $765,244 | $535,674 | $229,570 |
| 2023 | $10,779 | $750,240 | $525,171 | $225,069 |
| 2022 | $10,669 | $735,530 | $514,874 | $220,656 |
| 2021 | $10,407 | $721,109 | $504,779 | $216,330 |
| 2020 | $10,094 | $713,716 | $499,604 | $214,112 |
| 2019 | $9,846 | $699,722 | $489,808 | $209,914 |
| 2018 | $9,728 | $686,003 | $480,204 | $205,799 |
| 2017 | $9,240 | $672,553 | $470,789 | $201,764 |
| 2016 | $9,063 | $659,366 | $461,558 | $197,808 |
| 2015 | $9,001 | $649,462 | $454,625 | $194,837 |
| 2014 | $9,200 | $636,741 | $445,720 | $191,021 |
Source: Public Records
Map
Nearby Homes
- 1050 Villa Maria Ct
- 543 Minnesota Ave
- 1033 Villa Maria Ct
- 975 Prevost St
- 1269 Delmas Ave
- 1427 Alma Loop
- 709 Minnesota Ave
- 702 Minnesota Ave
- 749 Willow St
- 1414 Alma Way Unit G703
- 1375 Lick Ave Unit 522
- 1274 Palm St
- 1336 Bird Ave
- 914 Harliss Ave
- 531 Brooks Ave
- 1376 Palm St
- 373 Shadow Run Dr
- 554 Fisk Ave
- 1072 Vine St
- 306 Stonegate Cir
- 1166 Prevost St
- 1078 Villa Maria Ct
- 1082 Villa Maria Ct
- 1074 Villa Maria Ct
- 1070 Villa Maria Ct
- 1180 Prevost St
- 491 Minnesota Ave
- 487 Minnesota Ave
- 483 Minnesota Ave
- 495 Minnesota Ave
- 1194 Prevost St
- 1058 Villa Maria Ct
- 1067 Villa Maria Ct
- 1151 Prevost St
- 1165 Prevost St
- 477 Minnesota Ave
- 1063 Villa Maria Ct
- 1054 Villa Maria Ct
- 1059 Villa Maria Ct
- 1179 Prevost St
Your Personal Tour Guide
Ask me questions while you tour the home.