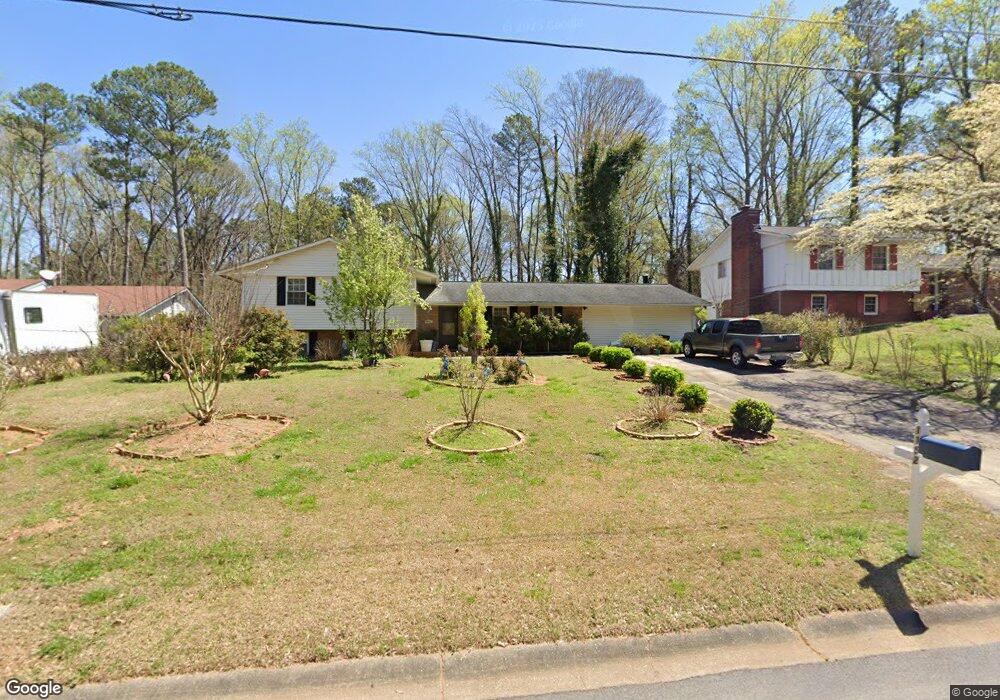
1152 Woodleigh Rd SW Marietta, GA 30008
Southwestern Marietta NeighborhoodEstimated Value: $304,000 - $349,000
3
Beds
2
Baths
1,917
Sq Ft
$172/Sq Ft
Est. Value
About This Home
This home is located at 1152 Woodleigh Rd SW, Marietta, GA 30008 and is currently estimated at $330,462, approximately $172 per square foot. 1152 Woodleigh Rd SW is a home located in Cobb County with nearby schools including Milford Elementary School, Smitha Middle School, and Osborne High School.
Ownership History
Date
Name
Owned For
Owner Type
Purchase Details
Closed on
Mar 1, 2011
Sold by
Salmeron Sonia L
Bought by
Federal Natl Mtg Assn Fnma
Current Estimated Value
Purchase Details
Closed on
May 31, 2007
Sold by
Mortgage Guaranty Insurance Co
Bought by
Salmeron Sonia L
Home Financials for this Owner
Home Financials are based on the most recent Mortgage that was taken out on this home.
Original Mortgage
$128,000
Interest Rate
6.16%
Mortgage Type
New Conventional
Purchase Details
Closed on
Dec 18, 2006
Sold by
Jp Morgan Chase Bank
Bought by
Mortgage Guarenty Insurance Co
Purchase Details
Closed on
Sep 26, 2002
Sold by
Winter Dorothy A
Bought by
Manwaring Scott C
Home Financials for this Owner
Home Financials are based on the most recent Mortgage that was taken out on this home.
Original Mortgage
$133,200
Interest Rate
7.88%
Mortgage Type
New Conventional
Create a Home Valuation Report for This Property
The Home Valuation Report is an in-depth analysis detailing your home's value as well as a comparison with similar homes in the area
Home Values in the Area
Average Home Value in this Area
Purchase History
| Date | Buyer | Sale Price | Title Company |
|---|---|---|---|
| Federal Natl Mtg Assn Fnma | $106,871 | -- | |
| Salmeron Sonia L | $128,000 | -- | |
| Mortgage Guarenty Insurance Co | $147,200 | -- | |
| Manwaring Scott C | $148,000 | -- |
Source: Public Records
Mortgage History
| Date | Status | Borrower | Loan Amount |
|---|---|---|---|
| Previous Owner | Salmeron Sonia L | $128,000 | |
| Previous Owner | Manwaring Scott C | $133,200 |
Source: Public Records
Tax History Compared to Growth
Tax History
| Year | Tax Paid | Tax Assessment Tax Assessment Total Assessment is a certain percentage of the fair market value that is determined by local assessors to be the total taxable value of land and additions on the property. | Land | Improvement |
|---|---|---|---|---|
| 2025 | $517 | $118,452 | $40,000 | $78,452 |
| 2024 | $520 | $118,452 | $40,000 | $78,452 |
| 2023 | $263 | $101,592 | $24,000 | $77,592 |
| 2022 | $422 | $85,832 | $24,000 | $61,832 |
| 2021 | $378 | $71,184 | $12,000 | $59,184 |
| 2020 | $378 | $71,184 | $12,000 | $59,184 |
| 2019 | $378 | $71,184 | $12,000 | $59,184 |
| 2018 | $378 | $71,184 | $12,000 | $59,184 |
| 2017 | $168 | $23,952 | $5,832 | $18,120 |
| 2016 | $169 | $23,952 | $5,832 | $18,120 |
| 2015 | $182 | $23,952 | $5,832 | $18,120 |
| 2014 | $186 | $23,952 | $0 | $0 |
Source: Public Records
Map
Nearby Homes
- 1197 Woodleigh Rd SW
- 1105 Woodleigh Rd SW
- 1104 Havel Dr SW
- 881 Whittington Pkwy
- 2615 Windage Dr SW
- 2760 Hicks Rd SW
- 1345 Windage Ct SW Unit 6
- 2907 Crest Ridge Ct SW
- 1086 Mornington Way
- 2381 Lakeside Place SW
- 2940 Caller Ct SW
- 1308 Willamette Way
- 1020 Hicksmil Dr SW
- 2964 Edgemont Ln SW
- 2379 Moseley Place SW
- 3075 Milford Chase SW
- 641 Favorwood Dr SW
- 1156 Woodleigh Rd SW Unit 21
- 1156 Woodleigh Rd SW
- 1148 Woodleigh Rd SW
- 1144 Woodleigh Rd SW
- 1153 Woodleigh Rd SW
- 1147 Woodleigh Rd SW
- 1160 Woodleigh Rd SW
- 1145 Woodleigh Rd SW
- 2542 Frost Dr SW
- 1140 Woodleigh Rd SW
- 1141 Woodleigh Rd SW
- 1157 Woodleigh Rd SW
- 1163 Woodleigh Rd SW
- 2530 Frost Dr SW
- 2548 Frost Dr SW
- 1136 Woodleigh Rd SW
- 1137 Woodleigh Rd SW
- 1171 Woodleigh Rd SW
- 2554 Frost Dr SW
- 1132 Woodleigh Rd SW