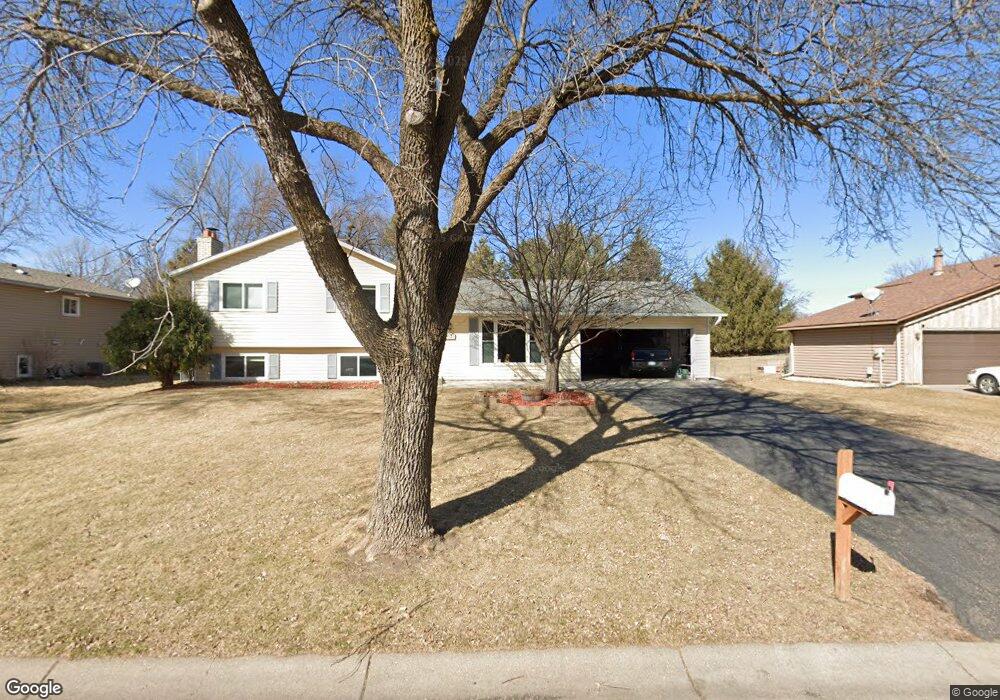
11522 99th Place N Maple Grove, MN 55369
Estimated Value: $390,000 - $410,000
3
Beds
2
Baths
1,578
Sq Ft
$251/Sq Ft
Est. Value
About This Home
This home is located at 11522 99th Place N, Maple Grove, MN 55369 and is currently estimated at $396,744, approximately $251 per square foot. 11522 99th Place N is a home located in Hennepin County with nearby schools including Elm Creek Elementary School, Osseo Middle School, and Osseo Senior High School.
Ownership History
Date
Name
Owned For
Owner Type
Purchase Details
Closed on
Sep 18, 2020
Sold by
Riley Alex and Riley Korey
Bought by
Jorgensen Jolene and Castellanos Alvaro
Current Estimated Value
Home Financials for this Owner
Home Financials are based on the most recent Mortgage that was taken out on this home.
Original Mortgage
$297,000
Outstanding Balance
$263,079
Interest Rate
2.8%
Mortgage Type
New Conventional
Estimated Equity
$133,665
Purchase Details
Closed on
Sep 10, 2018
Sold by
Johnson Kyle J and Johnson Jessica M
Bought by
Riley Alex and Kronforst Korey
Home Financials for this Owner
Home Financials are based on the most recent Mortgage that was taken out on this home.
Original Mortgage
$270,655
Interest Rate
4.49%
Mortgage Type
FHA
Purchase Details
Closed on
Feb 18, 2008
Sold by
Us Bank Na
Bought by
Johnson Kyle James
Purchase Details
Closed on
May 29, 2003
Sold by
Gilkay Amy M
Bought by
Groitzsch Roy E
Purchase Details
Closed on
Jun 29, 1998
Sold by
Francis John P and Francis Karen M
Bought by
Gilkay Amy M
Create a Home Valuation Report for This Property
The Home Valuation Report is an in-depth analysis detailing your home's value as well as a comparison with similar homes in the area
Home Values in the Area
Average Home Value in this Area
Purchase History
| Date | Buyer | Sale Price | Title Company |
|---|---|---|---|
| Jorgensen Jolene | $330,000 | Attorneys Title Group Llc | |
| Riley Alex | $280,000 | Burnet Title | |
| Johnson Kyle James | $187,000 | -- | |
| Groitzsch Roy E | $193,900 | -- | |
| Gilkay Amy M | $124,900 | -- | |
| Jorgensen Jolene Jolene | $330,000 | -- |
Source: Public Records
Mortgage History
| Date | Status | Borrower | Loan Amount |
|---|---|---|---|
| Open | Jorgensen Jolene | $297,000 | |
| Previous Owner | Riley Alex | $270,655 | |
| Closed | Jorgensen Jolene Jolene | $297,000 |
Source: Public Records
Tax History Compared to Growth
Tax History
| Year | Tax Paid | Tax Assessment Tax Assessment Total Assessment is a certain percentage of the fair market value that is determined by local assessors to be the total taxable value of land and additions on the property. | Land | Improvement |
|---|---|---|---|---|
| 2024 | $4,214 | $358,000 | $125,000 | $233,000 |
| 2023 | $4,304 | $370,000 | $131,600 | $238,400 |
| 2022 | $3,566 | $368,000 | $106,600 | $261,400 |
| 2021 | $3,356 | $302,100 | $80,300 | $221,800 |
| 2020 | $3,167 | $281,600 | $66,300 | $215,300 |
| 2019 | $3,158 | $255,100 | $63,000 | $192,100 |
| 2018 | $2,950 | $241,700 | $62,000 | $179,700 |
| 2017 | $2,792 | $205,800 | $52,000 | $153,800 |
| 2016 | $2,779 | $202,500 | $57,000 | $145,500 |
| 2015 | $2,836 | $201,100 | $59,000 | $142,100 |
| 2014 | -- | $184,900 | $56,500 | $128,400 |
Source: Public Records
Map
Nearby Homes
- 9880 Cottonwood Ln N
- 11043 104th Place N
- 6866 Zachary Ln N
- 9311 Kirkwood Ln N
- 9323 Kirkwood Ln N
- 9501 Revere Ln N
- 9201 Forestview Ln N
- 12795 95th Ave N
- 9323 Magnolia Ln N
- 10781 Boundary Creek Terrace
- 10000 Nathan Ln N
- 9132 Kirkwood Ln N
- 9058 Goldenrod Ln N
- 10162 93rd Ave N
- 13391 Territorial Cir N
- 13434 Territorial Cir N
- 12599 91st Place N
- 13485 Territorial Cir N
- 9667 103rd Place N
- 9987 106th Place N
- 11542 99th Place N
- 11502 99th Place N
- 11533 100th Ave N
- 11563 100th Ave N
- 11562 99th Place N
- 11503 100th Ave N
- 11492 99th Place N
- 9946 Deerwood Ln N
- 11453 100th Ave N
- 11593 100th Ave N
- 9947 Deerwood Ln N
- 11582 99th Place N
- 11423 100th Ave N
- 11605 100th Ave N
- 9936 Deerwood Ln N
- 11481 99th Place N
- 9937 Deerwood Ln N
- 9948 Evergreen Ln N
- 11602 99th Place N
- 11534 100th Ave N