Estimated Value: $755,000 - $1,048,497
2
Beds
1
Bath
960
Sq Ft
$921/Sq Ft
Est. Value
About This Home
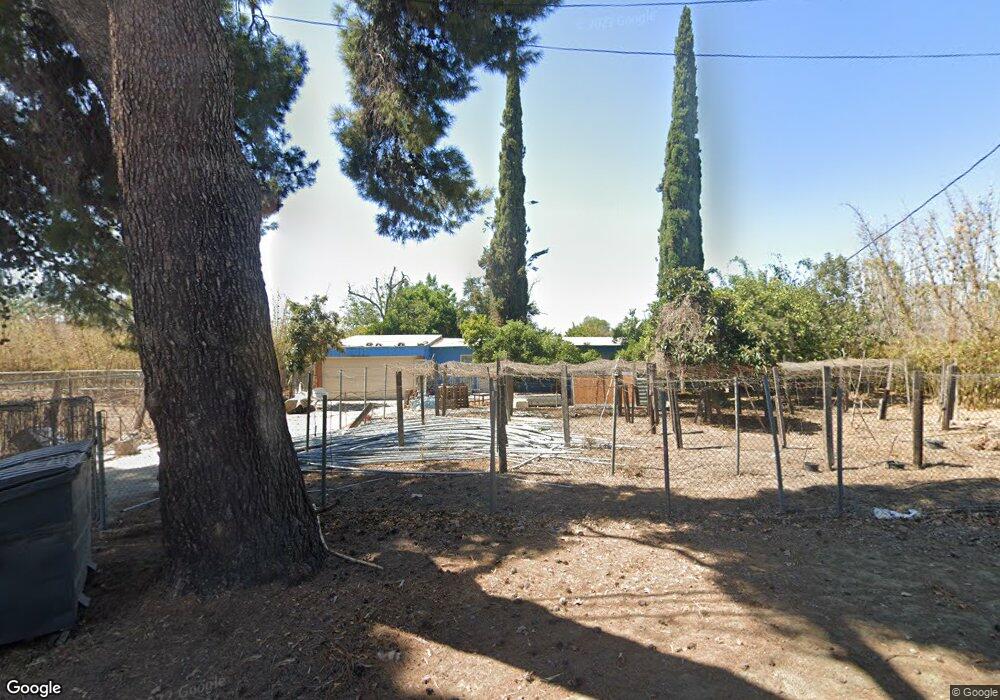
This home is located at 11522 Yorba Ave, Chino, CA 91710 and is currently estimated at $884,374, approximately $921 per square foot. 11522 Yorba Ave is a home located in San Bernardino County with nearby schools including E. J. Marshall Elementary, Ramona Junior High School, and Don Antonio Lugo High School.
Ownership History
Date
Name
Owned For
Owner Type
Purchase Details
Closed on
May 6, 2024
Sold by
Chen Charles and Chen Charles Chien
Bought by
Chen Family Trust and Chen
Current Estimated Value
Purchase Details
Closed on
Jun 21, 2013
Sold by
Yorba Investments Lp
Bought by
Tsai Chen Charles and Tsai Chen Kimmy
Purchase Details
Closed on
Feb 28, 2008
Sold by
Tsai Chen Charles
Bought by
Yorba Investments Lp
Purchase Details
Closed on
Mar 16, 2007
Sold by
Tsai Ching San
Bought by
Tsai Chen Charles and Tsai Chen Kimmy
Home Financials for this Owner
Home Financials are based on the most recent Mortgage that was taken out on this home.
Original Mortgage
$200,000
Interest Rate
6.31%
Mortgage Type
Purchase Money Mortgage
Create a Home Valuation Report for This Property
The Home Valuation Report is an in-depth analysis detailing your home's value as well as a comparison with similar homes in the area
Home Values in the Area
Average Home Value in this Area
Purchase History
| Date | Buyer | Sale Price | Title Company |
|---|---|---|---|
| Chen Family Trust | -- | None Listed On Document | |
| Tsai Chen Charles | -- | The Nations Title Co Of Ca | |
| Yorba Investments Lp | -- | None Available | |
| Tsai Chen Charles | $480,000 | Stewart Title Co |
Source: Public Records
Mortgage History
| Date | Status | Borrower | Loan Amount |
|---|---|---|---|
| Previous Owner | Tsai Chen Charles | $200,000 |
Source: Public Records
Tax History Compared to Growth
Tax History
| Year | Tax Paid | Tax Assessment Tax Assessment Total Assessment is a certain percentage of the fair market value that is determined by local assessors to be the total taxable value of land and additions on the property. | Land | Improvement |
|---|---|---|---|---|
| 2025 | $7,327 | $615,714 | $492,570 | $123,144 |
| 2024 | $7,327 | $603,641 | $482,912 | $120,729 |
| 2023 | $6,526 | $591,805 | $473,443 | $118,362 |
| 2022 | $6,488 | $580,201 | $464,160 | $116,041 |
| 2021 | $6,362 | $568,825 | $455,059 | $113,766 |
| 2020 | $6,280 | $562,992 | $450,393 | $112,599 |
| 2019 | $6,171 | $551,953 | $441,562 | $110,391 |
| 2018 | $6,036 | $541,130 | $432,904 | $108,226 |
| 2017 | $5,929 | $530,520 | $424,416 | $106,104 |
| 2016 | $5,542 | $520,118 | $416,094 | $104,024 |
| 2015 | $5,431 | $512,305 | $409,844 | $102,461 |
| 2014 | $5,319 | $502,270 | $401,816 | $100,454 |
Source: Public Records
Map
Nearby Homes
- 4625 Avondale Ct
- 4692 Granville St
- 11610 Sherwood Place
- 11620 Sherwood Place
- 4663 Granville St
- 4653 Granville St
- 4623 Granville St
- Maddox Plan at Yorba Estates
- Malone Plan at Yorba Estates
- Madeline Plan at Yorba Estates
- 11818 Yorba Ave
- 11250 Ramona Ave
- 11250 Ramona Ave Unit 216
- 5052 Taft St
- 5062 Taft St
- 4625 Avondale Place
- 11628 Solaire Way
- 5061 Chesapeake St
- 4400 Philadelphia St Unit 209
- 4400 Philadelphia St Unit 193
- 11576 Yorba Ave
- 11529 Yorba Ave
- 11448 Yorba Ave
- 11545 Yorba Ave
- 11588 Yorba Ave
- 11589 Yorba Ave
- 11475 Yorba Ave
- 11444 Yorba Ave
- 11419 Yorba Ave
- 11617 Yorba Ave
- 11424 Yorba Ave
- 4583 Elm St
- 11525 Ramona Ave
- 11515 Ramona Ave
- 11627 Yorba Ave
- 4765 Orange Blossom Ln
- 11565 Ramona Ave
- 11411 Yorba Ave
- 4582 Elm St
- 11647 Yorba Ave