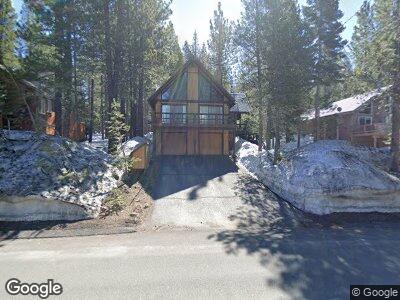
11523 Lausanne Way Truckee, CA 96161
Tahoe Donner NeighborhoodEstimated Value: $789,510 - $867,000
3
Beds
2
Baths
1,284
Sq Ft
$655/Sq Ft
Est. Value
About This Home
This home is located at 11523 Lausanne Way, Truckee, CA 96161 and is currently estimated at $841,378, approximately $655 per square foot. 11523 Lausanne Way is a home located in Nevada County with nearby schools including Truckee Elementary School, Alder Creek Middle School, and Tahoe Truckee High School.
Ownership History
Date
Name
Owned For
Owner Type
Purchase Details
Closed on
Jun 17, 2013
Sold by
Andrews Michael and Andrews Caren E
Bought by
Andrews Michael R and Andrews Caren E
Current Estimated Value
Purchase Details
Closed on
Oct 9, 2001
Sold by
Brose Howard F and Mary Brose Exemption Trust
Bought by
Andrews Michael and Andrews Caren E
Home Financials for this Owner
Home Financials are based on the most recent Mortgage that was taken out on this home.
Original Mortgage
$188,900
Interest Rate
5.75%
Purchase Details
Closed on
Nov 12, 1998
Sold by
Brose Howard F and Brose Family Trust
Bought by
Brose Howard F and Mary Brose Exemption Trust
Purchase Details
Closed on
Oct 12, 1998
Sold by
Brown Jeffrey L and Brown Kimberly R
Bought by
Brose Howard F and Brose Family Trust
Create a Home Valuation Report for This Property
The Home Valuation Report is an in-depth analysis detailing your home's value as well as a comparison with similar homes in the area
Home Values in the Area
Average Home Value in this Area
Purchase History
| Date | Buyer | Sale Price | Title Company |
|---|---|---|---|
| Andrews Michael R | -- | None Available | |
| Andrews Michael | $310,000 | Fidelity National Title | |
| Brose Howard F | -- | -- | |
| Brose Howard F | -- | Placer Title Company |
Source: Public Records
Mortgage History
| Date | Status | Borrower | Loan Amount |
|---|---|---|---|
| Open | Andrews Michael R | $146,000 | |
| Closed | Andrews Michael R | $177,868 | |
| Closed | Andrews Michael | $177,000 | |
| Closed | Andrews Michael | $187,310 | |
| Closed | Andrews Michael | $188,900 | |
| Previous Owner | Brose Howard F | $40,000 |
Source: Public Records
Tax History Compared to Growth
Tax History
| Year | Tax Paid | Tax Assessment Tax Assessment Total Assessment is a certain percentage of the fair market value that is determined by local assessors to be the total taxable value of land and additions on the property. | Land | Improvement |
|---|---|---|---|---|
| 2024 | $6,395 | $451,768 | $198,463 | $253,305 |
| 2023 | $6,395 | $442,911 | $194,572 | $248,339 |
| 2022 | $6,187 | $434,227 | $190,757 | $243,470 |
| 2021 | $5,855 | $425,655 | $186,958 | $238,697 |
| 2020 | $5,809 | $421,291 | $185,041 | $236,250 |
| 2019 | $5,794 | $413,031 | $181,413 | $231,618 |
| 2018 | $5,276 | $404,933 | $177,856 | $227,077 |
| 2017 | $5,146 | $396,998 | $174,373 | $222,625 |
| 2016 | $5,094 | $388,445 | $170,185 | $218,260 |
| 2015 | $4,981 | $382,613 | $167,631 | $214,982 |
| 2014 | $4,981 | $375,120 | $164,349 | $210,771 |
Source: Public Records
Map
Nearby Homes
- 11510 Lausanne Way
- 11391 Bennett Flat Rd
- 11654 Lausanne Way
- 11224 Bennett Flat Rd
- 11655 Lausanne Way
- 11828 Kitzbuhel Rd
- 11305 Northwoods Blvd Unit D
- 10894 Mougle Ln
- 11352 Northwoods Blvd Unit 4
- 12686 Zurich Place Unit 2
- 12685 Zurich Place
- 12712 Zurich Place
- 12755 Zurich Place
- 12305 Bennett Flat Rd
- 17308 Northwoods Blvd
- 12815 Zurich Place
- 17277 Northwoods Blvd Unit 3
- 11554 Saint Bernard Dr
- 12830 Saint Bernard Dr
- 12539 Lausanne Way
- 11523 Lausanne Way
- 11509 Lausanne Way
- 11537 Lausanne Way
- 11495 Lausanne Way
- 11530 Lausanne Way
- 11551 Lausanne Way
- 11481 Lausanne Way
- 11374 Mougle Ln
- 11496 Lausanne Way
- 11356 Mougle Ln
- 11565 Lausanne Way
- 11467 Lausanne Way
- 11550 Lausanne Way
- 11338 Mougle Ln
- 11564 Lausanne Way
- 11390 Mougle Ln
- 11300 Mougle Ln
- 11320 Mougle Ln
- 11406 Mougle Ln
- 11421 Bennett Flat Rd