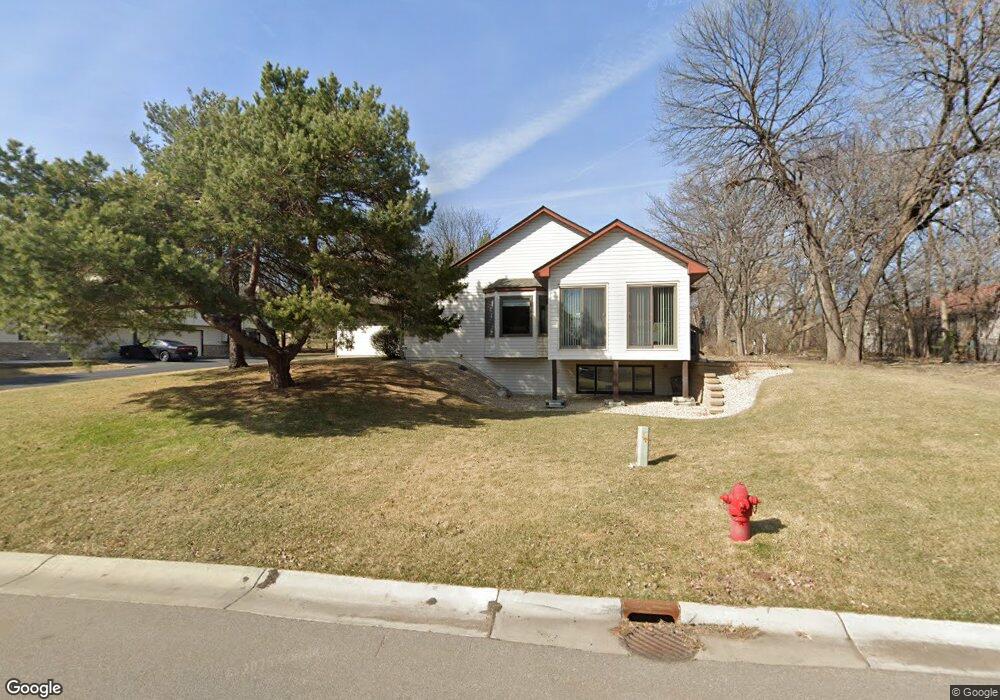
11526 88th Ave N Maple Grove, MN 55369
Estimated Value: $360,000 - $392,000
2
Beds
3
Baths
2,386
Sq Ft
$156/Sq Ft
Est. Value
About This Home
This home is located at 11526 88th Ave N, Maple Grove, MN 55369 and is currently estimated at $373,378, approximately $156 per square foot. 11526 88th Ave N is a home located in Hennepin County with nearby schools including Rice Lake Elementary School, Maple Grove Middle School, and Maple Grove Senior High School.
Ownership History
Date
Name
Owned For
Owner Type
Purchase Details
Closed on
Oct 11, 2022
Sold by
Habeck Patricia M
Bought by
Habeck Patricia M and Habeck Chad J
Current Estimated Value
Purchase Details
Closed on
Sep 16, 2022
Sold by
Patricia M Habeck Revocable Trust
Bought by
Habeck Patricia M
Purchase Details
Closed on
Jul 13, 2022
Sold by
Alan Young Roger and Alan Jean Betty
Bought by
Patricia M Habeck Revocable Trust
Purchase Details
Closed on
Sep 25, 2015
Sold by
Young Roger Alan and Krutzig Young Betty Jean
Bought by
Young Roger Alan and Krutzig Young Betty Jean
Purchase Details
Closed on
Mar 9, 2015
Sold by
Krutzig Betty Jean
Bought by
Young Roger Alan
Purchase Details
Closed on
Dec 28, 2012
Sold by
Parr Richard Richard
Bought by
Krutzig David David
Purchase Details
Closed on
Dec 6, 2012
Sold by
Parr Richard K and Parr Dorothy L
Bought by
Krutzig David J and Krutzig Betty J
Purchase Details
Closed on
Mar 3, 2005
Sold by
Boals Dorothy N
Bought by
Parr Richard K and Parr Dorothy L
Create a Home Valuation Report for This Property
The Home Valuation Report is an in-depth analysis detailing your home's value as well as a comparison with similar homes in the area
Home Values in the Area
Average Home Value in this Area
Purchase History
| Date | Buyer | Sale Price | Title Company |
|---|---|---|---|
| Habeck Patricia M | -- | None Listed On Document | |
| Habeck Patricia M | $500 | -- | |
| Patricia M Habeck Revocable Trust | $375,000 | None Listed On Document | |
| Young Roger Alan | -- | None Available | |
| Young Roger Alan | -- | None Available | |
| Krutzig David David | $200,000 | -- | |
| Krutzig David J | -- | Burnet Title | |
| Parr Richard K | $244,900 | -- |
Source: Public Records
Tax History
| Year | Tax Paid | Tax Assessment Tax Assessment Total Assessment is a certain percentage of the fair market value that is determined by local assessors to be the total taxable value of land and additions on the property. | Land | Improvement |
|---|---|---|---|---|
| 2024 | $4,207 | $356,500 | $68,900 | $287,600 |
| 2023 | $4,198 | $361,200 | $69,800 | $291,400 |
| 2022 | $3,371 | $357,600 | $53,300 | $304,300 |
| 2021 | $3,146 | $286,600 | $31,300 | $255,300 |
| 2020 | $3,368 | $264,300 | $25,900 | $238,400 |
| 2019 | $2,948 | $269,600 | $44,300 | $225,300 |
| 2018 | $2,932 | $227,500 | $23,800 | $203,700 |
| 2017 | $2,918 | $214,000 | $37,000 | $177,000 |
| 2016 | $2,807 | $204,300 | $41,000 | $163,300 |
| 2015 | $2,834 | $200,900 | $43,000 | $157,900 |
| 2014 | -- | $176,300 | $43,000 | $133,300 |
Source: Public Records
Map
Nearby Homes
- 8864 Cottonwood Ln N
- 11781 88th Ave N
- 8517 Forestview Ln N
- 12137 88th Place N
- 11899 85th Place N
- 12029 86th Ave N
- 12156 85th Place N
- 8936 Norwood Ln N
- 11668 84th Ave N Unit 303
- 8451 Jonquil Ln N
- 8414 Hemlock Ln N
- 8410 Jonquil Ln N
- 8406 Jonquil Ln N
- 8402 Jonquil Ln N
- 12443 90th Ave N
- 8358 Hemlock Ln N
- 8599 Oakview Way N
- 8411 Larch Ln N
- 12635 91st Ave N
- 10546 Weston Way N
- 11526 11526 88th-Avenue-n
- 11530 88th Ave N
- 11550 11550 88th-Avenue-n
- 11550 88th Ave N
- 11554 88th Ave N
- 11566 88th Ave N
- 11570 88th Ave N
- 8811 Cottonwood Ln N
- 8801 Cottonwood Ln N
- 11559 88th Place N
- 8825 Cottonwood Ln N
- 11567 88th Place N
- 11580 88th Ave N
- 11561 88th Ave N
- 8827 Cottonwood Ln N
- 8771 Cottonwood Ln N
- 11584 88th Ave N
- 11577 88th Ave N
- 11525 88th Ave N
- 11525 11525 88th-Avenue-n
Your Personal Tour Guide
Ask me questions while you tour the home.