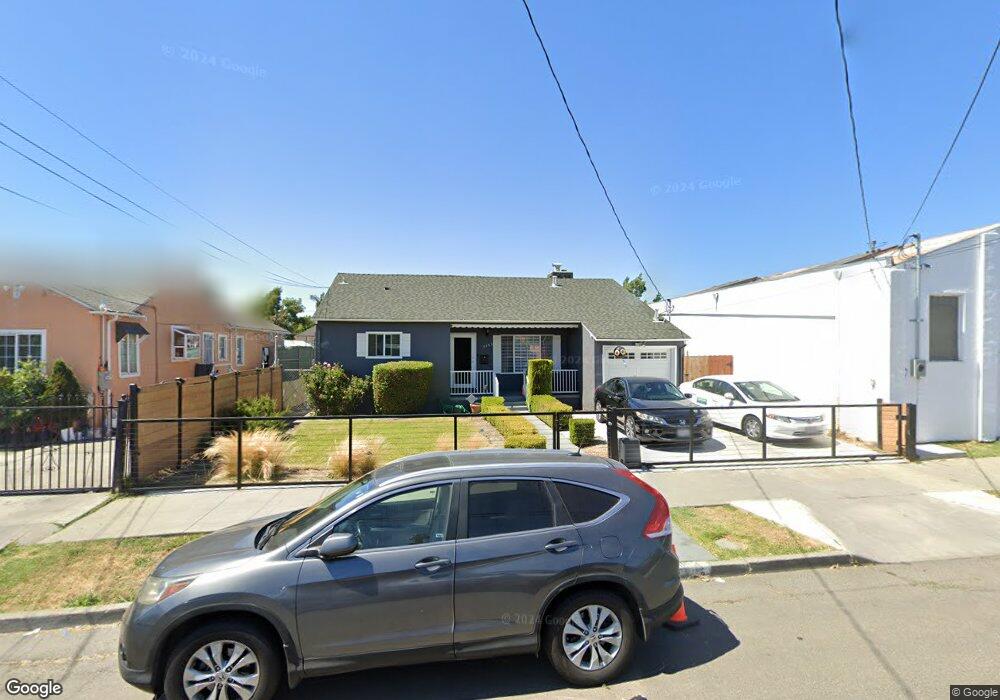
1153 88th Ave Oakland, CA 94621
Highland NeighborhoodEstimated Value: $339,000 - $668,000
3
Beds
1
Bath
1,305
Sq Ft
$371/Sq Ft
Est. Value
About This Home
This home is located at 1153 88th Ave, Oakland, CA 94621 and is currently estimated at $484,797, approximately $371 per square foot. 1153 88th Ave is a home located in Alameda County with nearby schools including New Highland Academy, Acorn Woodland Elementary School, and Encompass Academy Elementary.
Ownership History
Date
Name
Owned For
Owner Type
Purchase Details
Closed on
Mar 2, 2018
Sold by
Hall Randall A and Hall Otis
Bought by
Hall Randall A and Hall Otis
Current Estimated Value
Home Financials for this Owner
Home Financials are based on the most recent Mortgage that was taken out on this home.
Original Mortgage
$265,000
Outstanding Balance
$226,760
Interest Rate
4.32%
Mortgage Type
New Conventional
Estimated Equity
$258,037
Purchase Details
Closed on
Feb 20, 2009
Sold by
Hall Randall A and Hall Otis
Bought by
Hall Randall A and Hall Otis
Create a Home Valuation Report for This Property
The Home Valuation Report is an in-depth analysis detailing your home's value as well as a comparison with similar homes in the area
Home Values in the Area
Average Home Value in this Area
Purchase History
| Date | Buyer | Sale Price | Title Company |
|---|---|---|---|
| Hall Randall A | $13,500 | First American Title Company | |
| Hall Randall A | -- | None Available |
Source: Public Records
Mortgage History
| Date | Status | Borrower | Loan Amount |
|---|---|---|---|
| Open | Hall Randall A | $265,000 |
Source: Public Records
Tax History Compared to Growth
Tax History
| Year | Tax Paid | Tax Assessment Tax Assessment Total Assessment is a certain percentage of the fair market value that is determined by local assessors to be the total taxable value of land and additions on the property. | Land | Improvement |
|---|---|---|---|---|
| 2025 | $3,438 | $122,088 | $41,488 | $87,600 |
| 2024 | $3,438 | $119,556 | $40,674 | $85,882 |
| 2023 | $3,480 | $124,075 | $39,877 | $84,198 |
| 2022 | $3,317 | $114,643 | $39,095 | $82,548 |
| 2021 | $3,026 | $112,257 | $38,328 | $80,929 |
| 2020 | $2,988 | $118,036 | $37,936 | $80,100 |
| 2019 | $2,880 | $115,722 | $37,192 | $78,530 |
| 2018 | $1,790 | $45,035 | $17,669 | $27,366 |
| 2017 | $1,681 | $44,152 | $17,323 | $26,829 |
| 2016 | $1,523 | $43,286 | $16,983 | $26,303 |
| 2015 | $1,507 | $42,636 | $16,728 | $25,908 |
| 2014 | $1,346 | $41,801 | $16,400 | $25,401 |
Source: Public Records
Map
Nearby Homes