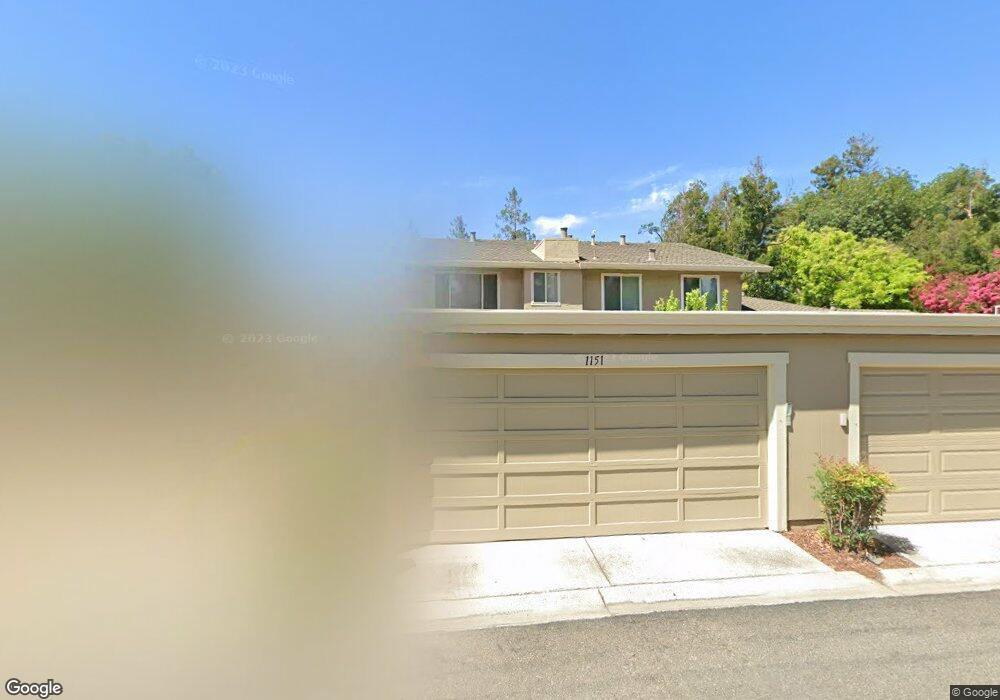
1153 Arbor Vista Way Unit 19 San Jose, CA 95126
Willow Glen NeighborhoodEstimated Value: $731,000 - $935,000
2
Beds
2
Baths
1,150
Sq Ft
$739/Sq Ft
Est. Value
About This Home
This home is located at 1153 Arbor Vista Way Unit 19, San Jose, CA 95126 and is currently estimated at $849,446, approximately $738 per square foot. 1153 Arbor Vista Way Unit 19 is a home located in Santa Clara County with nearby schools including Del Mar High School, Blackford Elementary, and Sherman Oaks Elementary School.
Ownership History
Date
Name
Owned For
Owner Type
Purchase Details
Closed on
Mar 18, 2003
Sold by
Lasalle Michael and Lasalle Kristi
Bought by
Lassalle Michael and Lassalle Kristi
Current Estimated Value
Home Financials for this Owner
Home Financials are based on the most recent Mortgage that was taken out on this home.
Original Mortgage
$299,800
Outstanding Balance
$128,036
Interest Rate
5.79%
Mortgage Type
Purchase Money Mortgage
Estimated Equity
$721,410
Purchase Details
Closed on
Apr 26, 2001
Sold by
Barranti Frank C
Bought by
Lassalle Michael and Lassalle Kristi
Home Financials for this Owner
Home Financials are based on the most recent Mortgage that was taken out on this home.
Original Mortgage
$304,000
Interest Rate
6.89%
Purchase Details
Closed on
Apr 10, 1997
Sold by
Wolfe Bess M
Bought by
Barranti Frank C
Create a Home Valuation Report for This Property
The Home Valuation Report is an in-depth analysis detailing your home's value as well as a comparison with similar homes in the area
Home Values in the Area
Average Home Value in this Area
Purchase History
| Date | Buyer | Sale Price | Title Company |
|---|---|---|---|
| Lassalle Michael | -- | Financial Title Company | |
| Lassalle Michael | $380,000 | Stewart Title | |
| Barranti Frank C | $200,000 | Fidelity National Title Co |
Source: Public Records
Mortgage History
| Date | Status | Borrower | Loan Amount |
|---|---|---|---|
| Open | Lassalle Michael | $299,800 | |
| Closed | Lassalle Michael | $304,000 | |
| Closed | Lassalle Michael | $57,000 |
Source: Public Records
Tax History Compared to Growth
Tax History
| Year | Tax Paid | Tax Assessment Tax Assessment Total Assessment is a certain percentage of the fair market value that is determined by local assessors to be the total taxable value of land and additions on the property. | Land | Improvement |
|---|---|---|---|---|
| 2025 | $8,197 | $572,578 | $229,027 | $343,551 |
| 2024 | $8,197 | $561,352 | $224,537 | $336,815 |
| 2023 | $8,025 | $550,346 | $220,135 | $330,211 |
| 2022 | $7,991 | $539,556 | $215,819 | $323,737 |
| 2021 | $7,812 | $528,978 | $211,588 | $317,390 |
| 2020 | $7,589 | $523,555 | $209,419 | $314,136 |
| 2019 | $7,479 | $513,290 | $205,313 | $307,977 |
| 2018 | $7,272 | $503,227 | $201,288 | $301,939 |
| 2017 | $7,176 | $493,361 | $197,342 | $296,019 |
| 2016 | $6,780 | $483,688 | $193,473 | $290,215 |
| 2015 | $6,684 | $476,423 | $190,567 | $285,856 |
| 2014 | $6,098 | $467,092 | $186,835 | $280,257 |
Source: Public Records
Map
Nearby Homes
- 1114 Vanessa Dr
- 1133 Cooper River Dr Unit 42
- 1492 Aurelian Ln
- 1485 De Rose Way Unit 123
- 1515 Rhinecliff Way
- 1503 Willowhaven Ct
- 1785 Santa Barbara Dr
- 1566 Stokes St
- 1182 Leigh Ave
- 960 Lakeshire Ct
- 1668 Dolores Dr
- 1494 Meridian Ave
- 1990 Southwest Expy
- 1874 Huxley Ct
- 1831 Ashmeade Ct
- 1013 Camino Pablo
- 1707 Fruitdale Ave
- 1932 Huxley Ct
- 980 Princess Anne Dr
- 803 Corlista Dr
- 1151 Arbor Vista Way
- 1149 Arbor Vista Way
- 1147 Arbor Vista Way
- 1145 Arbor Vista Way Unit 23
- 1442 Stokes St
- 1154 Arbor Vista Way
- 1436 Stokes St
- 1132 Longbranch Ct
- 1152 Arbor Vista Way
- 1134 Longbranch Ct
- 1150 Arbor Vista Way
- 1440 Stokes St
- 1438 Stokes St
- 1143 Arbor Vista Way
- 1444 Stokes St
- 1448 Stokes St
- 1148 Arbor Vista Way
- 1446 Stokes St
- 1434 Stokes St Unit 5
- 1130 Longbranch Ct Unit 16