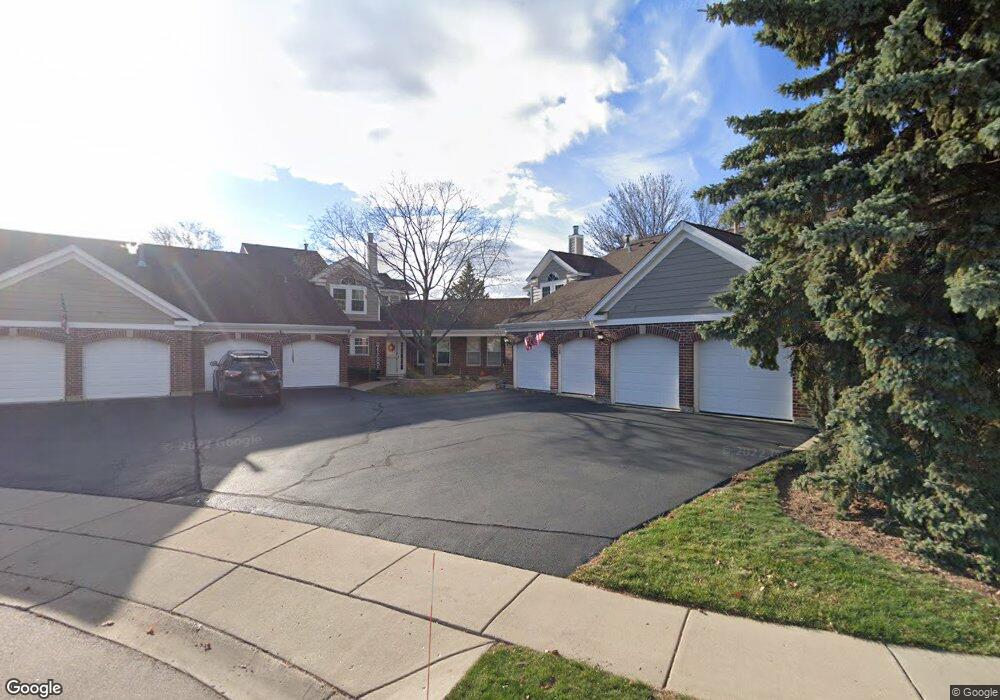
1153 Saint Andrews Ct Unit 263 Algonquin, IL 60102
Estimated Value: $312,000 - $323,000
2
Beds
3
Baths
2,180
Sq Ft
$145/Sq Ft
Est. Value
About This Home
This home is located at 1153 Saint Andrews Ct Unit 263, Algonquin, IL 60102 and is currently estimated at $317,123, approximately $145 per square foot. 1153 Saint Andrews Ct Unit 263 is a home located in McHenry County with nearby schools including Westfield Community School, Kenneth E Neubert Elementary School, and Harry D Jacobs High School.
Ownership History
Date
Name
Owned For
Owner Type
Purchase Details
Closed on
Mar 17, 2017
Sold by
Thompson Melissa
Bought by
Petes Erin C and Spong Joshua A
Current Estimated Value
Home Financials for this Owner
Home Financials are based on the most recent Mortgage that was taken out on this home.
Original Mortgage
$161,020
Outstanding Balance
$134,262
Interest Rate
4.37%
Mortgage Type
New Conventional
Estimated Equity
$182,861
Purchase Details
Closed on
May 21, 1999
Sold by
Boomer Diane L and Hunter Diane L
Bought by
Capriotti Linda A
Home Financials for this Owner
Home Financials are based on the most recent Mortgage that was taken out on this home.
Original Mortgage
$156,600
Interest Rate
6.87%
Create a Home Valuation Report for This Property
The Home Valuation Report is an in-depth analysis detailing your home's value as well as a comparison with similar homes in the area
Home Values in the Area
Average Home Value in this Area
Purchase History
| Date | Buyer | Sale Price | Title Company |
|---|---|---|---|
| Petes Erin C | $166,000 | Heritage Title Co | |
| Capriotti Linda A | $174,000 | Attorneys Title Guaranty Fun |
Source: Public Records
Mortgage History
| Date | Status | Borrower | Loan Amount |
|---|---|---|---|
| Open | Petes Erin C | $161,020 | |
| Previous Owner | Capriotti Linda A | $156,600 |
Source: Public Records
Tax History Compared to Growth
Tax History
| Year | Tax Paid | Tax Assessment Tax Assessment Total Assessment is a certain percentage of the fair market value that is determined by local assessors to be the total taxable value of land and additions on the property. | Land | Improvement |
|---|---|---|---|---|
| 2024 | $5,636 | $80,045 | $15,898 | $64,147 |
| 2023 | $5,323 | $71,590 | $14,219 | $57,371 |
| 2022 | $5,307 | $67,879 | $22,456 | $45,423 |
| 2021 | $5,079 | $63,237 | $20,920 | $42,317 |
| 2020 | $4,938 | $60,998 | $20,179 | $40,819 |
| 2019 | $4,810 | $58,383 | $19,314 | $39,069 |
| 2018 | $4,964 | $58,082 | $17,842 | $40,240 |
| 2017 | $4,851 | $54,717 | $16,808 | $37,909 |
| 2016 | $4,766 | $51,319 | $15,764 | $35,555 |
| 2013 | -- | $62,411 | $14,706 | $47,705 |
Source: Public Records
Map
Nearby Homes
- 1405 Surrey Ln
- 1 N Hubbard St
- SWC Talaga and Algonquin Rd
- 1820 Crofton Dr
- 2043 Peach Tree Ln Unit 4122
- 741 Regal Ln
- 1801 Arbordale Ln
- 000 County Line Rd
- 1900 Waverly Ln
- 700 Fairfield Ln
- 30 Arbordale Ct Unit 4284
- 2233 Dawson Ln Unit 312
- 710 Braewood Dr
- 710 Sprucetree Ln
- Adams Plan at Algonquin Meadows - Single Family
- Sequoia Plan at Algonquin Meadows - Single Family
- Bryce Plan at Algonquin Meadows - Single Family
- Rainier Plan at Algonquin Meadows - Single Family
- Santa Rosa Plan at Algonquin Meadows - Single Family
- Biscayne Plan at Algonquin Meadows - Single Family
- 1155 Saint Andrews Ct Unit 262
- 1157 Saint Andrews Ct Unit 261
- 1151 Saint Andrews Ct
- 1153 Saint Andrews Ct Unit 1153
- 1137 Saint Andrews Ct
- 1161 Saint Andrews Ct
- 1161 St Andrews Ct
- 1135 Saint Andrews Ct
- 1144 Saint Andrews Ct Unit 224
- 1163 Saint Andrews Ct
- 1142 Saint Andrews Ct Unit 223
- 1165 Saint Andrews Ct
- 1165 St Andrews Ct Unit 1165
- 1167 Saint Andrews Ct Unit 253
- 1167 St Andrews Ct
- 1167 St Andrews Ct Unit 1167
- 1171 Saint Andrews Ct
- 1133 Saint Andrews Ct Unit 273
- 1152 Saint Andrews Ct Unit 231
- 1152 St Andrews Ct Unit 1152