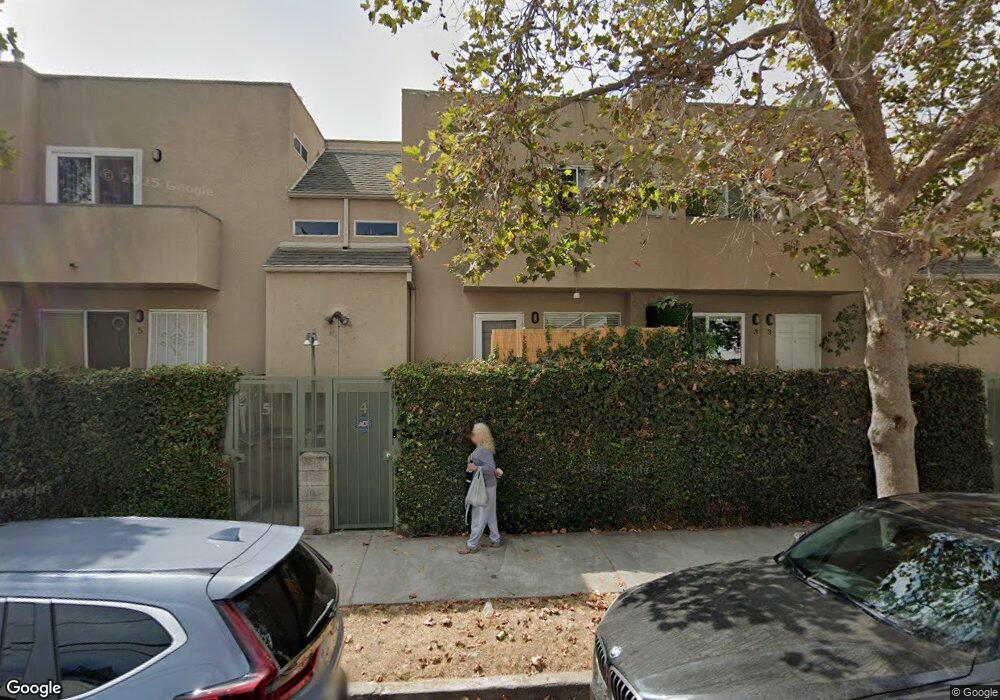
1154 N Sycamore Ave Unit 11 Los Angeles, CA 90038
Hollywood NeighborhoodEstimated Value: $755,000 - $1,065,000
2
Beds
3
Baths
1,091
Sq Ft
$811/Sq Ft
Est. Value
About This Home
This home is located at 1154 N Sycamore Ave Unit 11, Los Angeles, CA 90038 and is currently estimated at $884,258, approximately $810 per square foot. 1154 N Sycamore Ave Unit 11 is a home located in Los Angeles County with nearby schools including Gardner Street Elementary School, Hubert Howe Bancroft Middle School, and Hollywood Senior High School.
Ownership History
Date
Name
Owned For
Owner Type
Purchase Details
Closed on
Dec 27, 2005
Sold by
Jay James A
Bought by
Wasik John Gregory
Current Estimated Value
Home Financials for this Owner
Home Financials are based on the most recent Mortgage that was taken out on this home.
Original Mortgage
$450,000
Outstanding Balance
$261,823
Interest Rate
6.87%
Mortgage Type
Stand Alone First
Estimated Equity
$622,435
Purchase Details
Closed on
Aug 23, 1999
Sold by
Jay Alberta H Tr Jay Trust
Bought by
Jay James A
Purchase Details
Closed on
Jan 28, 1997
Sold by
Jay Alberta H
Bought by
Jay Alberta H and Jay Living Trust
Purchase Details
Closed on
Sep 13, 1996
Sold by
West Leonora E
Bought by
Jay Alberta H
Home Financials for this Owner
Home Financials are based on the most recent Mortgage that was taken out on this home.
Original Mortgage
$65,000
Interest Rate
7.87%
Create a Home Valuation Report for This Property
The Home Valuation Report is an in-depth analysis detailing your home's value as well as a comparison with similar homes in the area
Home Values in the Area
Average Home Value in this Area
Purchase History
| Date | Buyer | Sale Price | Title Company |
|---|---|---|---|
| Wasik John Gregory | $562,500 | First American Title Company | |
| Jay James A | -- | -- | |
| Jay Alberta H | -- | -- | |
| Jay Alberta H | $125,000 | Equity Title |
Source: Public Records
Mortgage History
| Date | Status | Borrower | Loan Amount |
|---|---|---|---|
| Open | Wasik John Gregory | $450,000 | |
| Previous Owner | Jay Alberta H | $65,000 |
Source: Public Records
Tax History Compared to Growth
Tax History
| Year | Tax Paid | Tax Assessment Tax Assessment Total Assessment is a certain percentage of the fair market value that is determined by local assessors to be the total taxable value of land and additions on the property. | Land | Improvement |
|---|---|---|---|---|
| 2025 | $9,108 | $768,682 | $632,036 | $136,646 |
| 2024 | $9,108 | $753,611 | $619,644 | $133,967 |
| 2023 | $8,932 | $738,836 | $607,495 | $131,341 |
| 2022 | $8,515 | $724,350 | $595,584 | $128,766 |
| 2021 | $8,406 | $710,148 | $583,906 | $126,242 |
| 2019 | $8,150 | $689,087 | $566,588 | $122,499 |
| 2018 | $8,119 | $675,577 | $555,479 | $120,098 |
| 2016 | $7,762 | $649,346 | $533,910 | $115,436 |
| 2015 | $5,506 | $460,000 | $378,800 | $81,200 |
| 2014 | $5,638 | $460,000 | $378,800 | $81,200 |
Source: Public Records
Map
Nearby Homes
- 1154 N Sycamore Ave Unit 8
- 1206 N Sycamore Ave
- 1143 N Sycamore Ave
- 1215 N Sycamore Ave
- 6913 N Tierno Ln
- 6910 N Tierno Ln
- 7154 Lexington Ave
- 1310 N Detroit St Unit 405
- 1153 N Formosa Ave Unit 2
- 1227 N Formosa Ave Unit 2
- 1351 N Orange Dr Unit 212
- 1351 N Orange Dr Unit 106
- 1319 N Detroit St Unit 203
- 1249 N Formosa Ave
- 1400 N Sycamore Ave
- 6736 W Hepburn Way
- 6732 W Hepburn Way
- 6737 W Hepburn Way
- 1208 Poinsettia Dr
- 1411 N Detroit St Unit 205
- 1154 N Sycamore Ave Unit 6
- 1154 N Sycamore Ave Unit 9
- 1154 N Sycamore Ave Unit 7
- 1154 N Sycamore Ave Unit 5
- 1154 N Sycamore Ave Unit 4
- 1154 N Sycamore Ave Unit 3
- 1154 N Sycamore Ave Unit 2
- 1154 N Sycamore Ave Unit 1
- 1154 N Sycamore Ave Unit 12
- 1154 N Sycamore Ave Unit 10
- 1150 N Sycamore Ave
- 1150 N Sycamore Ave Unit 5
- 1150 N Sycamore Ave
- 1150 N Sycamore Ave
- 1152 1/2 N Sycamore Ave Unit B
- 1152 1/2 N Sycamore Ave
- 1152 N Sycamore Ave
- 1152 N Sycamore Ave Unit House
- 1152 N Sycamore Ave
- 1148 N Sycamore Ave