Estimated Value: $1,020,000 - $1,446,000
6
Beds
3
Baths
1,124
Sq Ft
$1,147/Sq Ft
Est. Value
About This Home
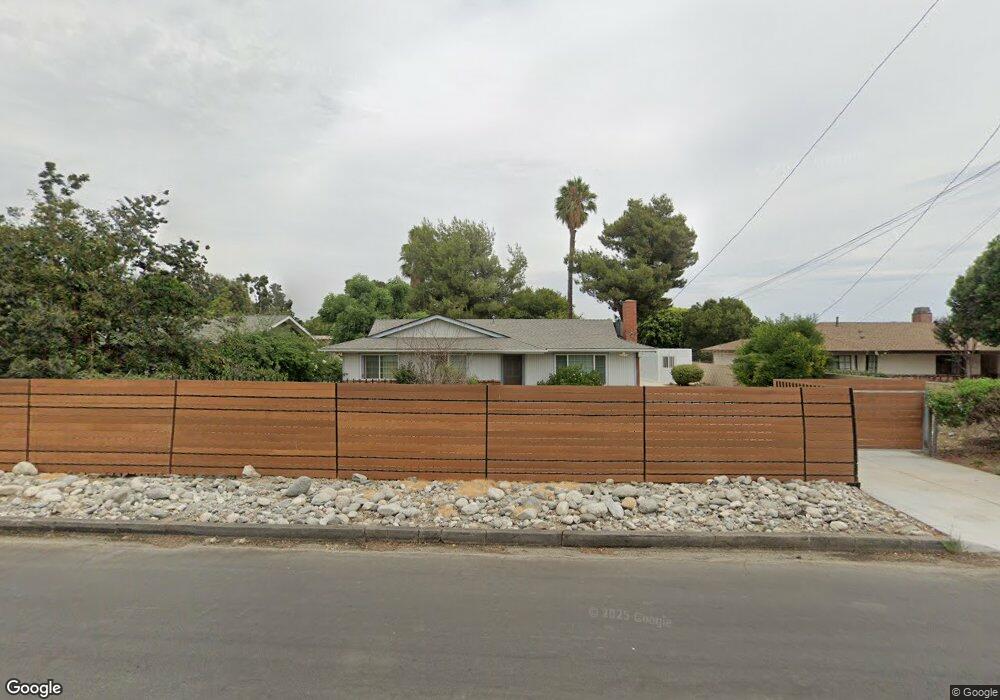
This home is located at 11545 Yorba Ave, Chino, CA 91710 and is currently estimated at $1,289,477, approximately $1,147 per square foot. 11545 Yorba Ave is a home located in San Bernardino County with nearby schools including E. J. Marshall Elementary, Ramona Junior High School, and Don Antonio Lugo High School.
Ownership History
Date
Name
Owned For
Owner Type
Purchase Details
Closed on
Mar 9, 2005
Sold by
Cox Tracy
Bought by
Tamang Abel and Tamang Rani
Current Estimated Value
Home Financials for this Owner
Home Financials are based on the most recent Mortgage that was taken out on this home.
Original Mortgage
$720,000
Outstanding Balance
$371,290
Interest Rate
5.87%
Mortgage Type
Purchase Money Mortgage
Estimated Equity
$918,187
Purchase Details
Closed on
Aug 24, 2004
Sold by
Goodrich R L
Bought by
Cox Tracy
Home Financials for this Owner
Home Financials are based on the most recent Mortgage that was taken out on this home.
Original Mortgage
$112,404
Interest Rate
5.69%
Mortgage Type
Stand Alone Second
Purchase Details
Closed on
Aug 18, 2004
Sold by
Stowe Jefferson Floyd
Bought by
Cox Tracy
Home Financials for this Owner
Home Financials are based on the most recent Mortgage that was taken out on this home.
Original Mortgage
$112,404
Interest Rate
5.69%
Mortgage Type
Stand Alone Second
Create a Home Valuation Report for This Property
The Home Valuation Report is an in-depth analysis detailing your home's value as well as a comparison with similar homes in the area
Home Values in the Area
Average Home Value in this Area
Purchase History
| Date | Buyer | Sale Price | Title Company |
|---|---|---|---|
| Tamang Abel | $900,000 | Chicago San Diego | |
| Cox Tracy | $315,000 | Chicago San Diego | |
| Cox Tracy | $280,000 | Chicago San Diego |
Source: Public Records
Mortgage History
| Date | Status | Borrower | Loan Amount |
|---|---|---|---|
| Open | Tamang Abel | $720,000 | |
| Previous Owner | Cox Tracy | $112,404 | |
| Previous Owner | Cox Tracy | $599,488 |
Source: Public Records
Tax History Compared to Growth
Tax History
| Year | Tax Paid | Tax Assessment Tax Assessment Total Assessment is a certain percentage of the fair market value that is determined by local assessors to be the total taxable value of land and additions on the property. | Land | Improvement |
|---|---|---|---|---|
| 2025 | $13,617 | $1,254,527 | $975,744 | $278,783 |
| 2024 | $13,617 | $1,229,929 | $956,612 | $273,317 |
| 2023 | $13,240 | $1,205,813 | $937,855 | $267,958 |
| 2022 | $13,162 | $1,182,170 | $919,466 | $262,704 |
| 2021 | $12,906 | $1,158,990 | $901,437 | $257,553 |
| 2020 | $12,739 | $1,147,106 | $892,194 | $254,912 |
| 2019 | $12,516 | $1,124,614 | $874,700 | $249,914 |
| 2018 | $12,240 | $1,102,563 | $857,549 | $245,014 |
| 2017 | $12,022 | $1,080,944 | $840,734 | $240,210 |
| 2016 | $11,234 | $1,059,749 | $824,249 | $235,500 |
| 2015 | $11,009 | $1,043,831 | $811,868 | $231,963 |
| 2014 | $10,780 | $1,023,384 | $795,965 | $227,419 |
Source: Public Records
Map
Nearby Homes
- 4685 Avondale Ct
- 4665 Avondale Ct
- 4692 Granville St
- 4625 Avondale Ct
- 4663 Granville St
- 4653 Granville St
- 4623 Granville St
- 11610 Sherwood Place
- 11620 Sherwood Place
- Maddox Plan at Yorba Estates
- Malone Plan at Yorba Estates
- Madeline Plan at Yorba Estates
- 11818 Yorba Ave
- 5052 Taft St
- 5062 Taft St
- 4625 Avondale Place
- 11628 Solaire Way
- 11250 Ramona Ave Unit 216
- 11250 Ramona Ave
- 5061 Chesapeake St
- 11529 Yorba Ave
- 11589 Yorba Ave
- 11617 Yorba Ave
- 11576 Yorba Ave
- 11588 Yorba Ave
- 11522 Yorba Ave
- 11627 Yorba Ave
- 11647 Yorba Ave
- 4758 Francis Ave
- 11528 Monte Vista Ave
- 11584 Monte Vista Ave
- 11475 Yorba Ave
- 4740 Francis Ave
- 11448 Yorba Ave
- 4770 Francis Ave
- 4746 Francis Ave
- 11419 Yorba Ave
- 4765 Orange Blossom Ln
- 4664 Francis Ave
- 4736 Francis Ave