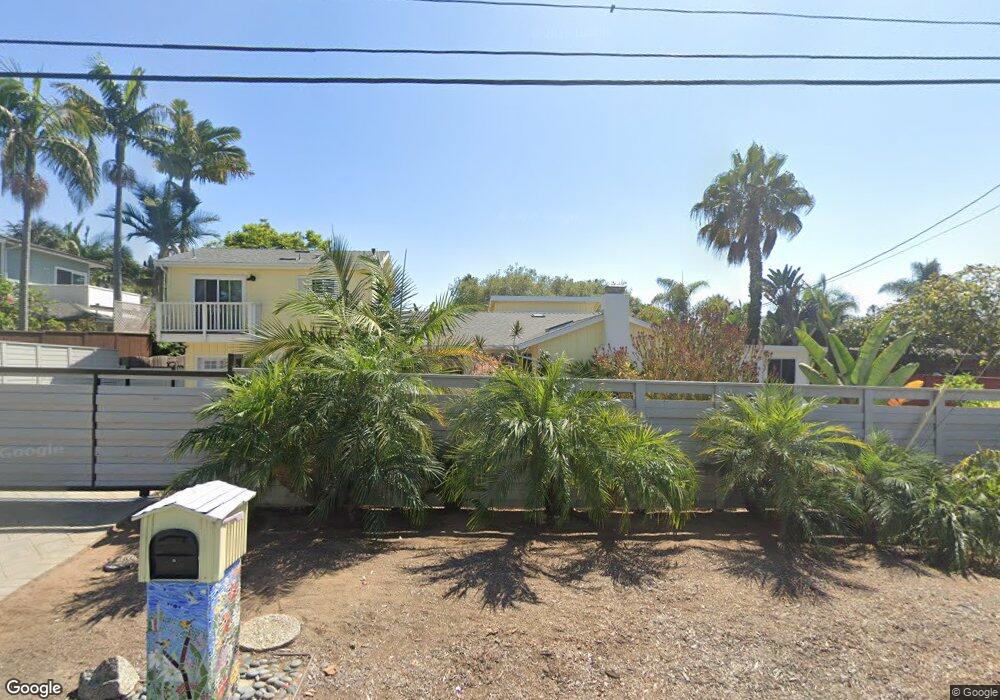
1155 Melba Rd Encinitas, CA 92024
Central Encinitas NeighborhoodEstimated Value: $2,113,000 - $2,271,000
3
Beds
2
Baths
1,465
Sq Ft
$1,481/Sq Ft
Est. Value
About This Home
This home is located at 1155 Melba Rd, Encinitas, CA 92024 and is currently estimated at $2,169,670, approximately $1,481 per square foot. 1155 Melba Rd is a home located in San Diego County with nearby schools including Ocean Knoll Elementary School, Oak Crest Middle School, and La Costa Canyon High School.
Ownership History
Date
Name
Owned For
Owner Type
Purchase Details
Closed on
Jun 23, 2017
Sold by
Woodward Jonathan and Tanha Naimeh
Bought by
Woodward Jonathan and Tanha Naimeh
Current Estimated Value
Purchase Details
Closed on
Jul 19, 2011
Sold by
Ball Donna Carol
Bought by
Woodward Jonathan and Tanha Naimeh
Home Financials for this Owner
Home Financials are based on the most recent Mortgage that was taken out on this home.
Original Mortgage
$540,000
Outstanding Balance
$350,917
Interest Rate
3.37%
Mortgage Type
New Conventional
Estimated Equity
$1,818,753
Purchase Details
Closed on
Apr 13, 1999
Sold by
Ball Donna C
Bought by
Ball Donna Carol and Donna Carol Ball Trust
Purchase Details
Closed on
Jan 7, 1988
Purchase Details
Closed on
May 18, 1987
Create a Home Valuation Report for This Property
The Home Valuation Report is an in-depth analysis detailing your home's value as well as a comparison with similar homes in the area
Home Values in the Area
Average Home Value in this Area
Purchase History
| Date | Buyer | Sale Price | Title Company |
|---|---|---|---|
| Woodward Jonathan | -- | None Available | |
| Woodward Jonathan | $675,000 | California Title Company | |
| Ball Donna Carol | -- | -- | |
| -- | $224,500 | -- | |
| -- | $192,500 | -- |
Source: Public Records
Mortgage History
| Date | Status | Borrower | Loan Amount |
|---|---|---|---|
| Open | Woodward Jonathan | $540,000 |
Source: Public Records
Tax History
| Year | Tax Paid | Tax Assessment Tax Assessment Total Assessment is a certain percentage of the fair market value that is determined by local assessors to be the total taxable value of land and additions on the property. | Land | Improvement |
|---|---|---|---|---|
| 2025 | $12,099 | $1,062,148 | $566,490 | $495,658 |
| 2024 | $12,099 | $1,041,323 | $555,383 | $485,940 |
| 2023 | $11,154 | $812,517 | $533,818 | $278,699 |
| 2022 | $9,789 | $812,517 | $533,818 | $278,699 |
| 2021 | $9,277 | $796,586 | $523,351 | $273,235 |
| 2020 | $9,228 | $788,419 | $517,985 | $270,434 |
| 2019 | $9,053 | $772,961 | $507,829 | $265,132 |
| 2018 | $8,900 | $757,806 | $497,872 | $259,934 |
| 2017 | $8,693 | $742,948 | $488,110 | $254,838 |
| 2016 | $8,252 | $728,382 | $478,540 | $249,842 |
| 2015 | $7,884 | $705,442 | $471,352 | $234,090 |
| 2014 | $7,569 | $691,624 | $462,119 | $229,505 |
Source: Public Records
Map
Nearby Homes
- 1280 Santa fe Dr
- 0 Crest Dr Unit 250045003
- 1341 Caminito Septimo
- 760 Bonita Dr
- 1320 Evergreen Dr
- 1386 Lake Dr
- 935 Encinitas Blvd
- 917 Santo Way
- 608 Crest Dr
- 1009 Arcadia Rd
- 664 Sea Ridge Ct
- 349 Horizon Dr
- 1510 Orangeview Dr Unit 1&2
- 1168 Arcadia Rd
- 1015 Gardena Rd
- 926 Nolbey St
- 800 Encinitas Blvd Unit 104
- 1428 Mackinnon Ave
- 1549 Avenida de Las Adelsas
- 1503 Villa Cardiff Dr
- 1145 Melba Rd
- 1165 Melba Rd
- 1030 Oceanic Dr
- 1150 Melba Rd
- 1029 Monterey Vista Way
- 1000 Oceanic Dr
- 1025 Monterey Vista Way
- 1135 Melba Rd
- 1033 Monterey Vista Way
- 1050 Oceanic Dr
- 1021 Monterey Vista Way
- 940 Bluejack Rd
- 1131 Melba Rd
- 1023 Oceanic Dr
- 1017 Monterey Vista Way
- 1205 Melba Rd
- 1025 Balour Dr
- 1037 Monterey Vista Way
- 1033 Oceanic Dr
- 1045 Oceanic Dr
Your Personal Tour Guide
Ask me questions while you tour the home.