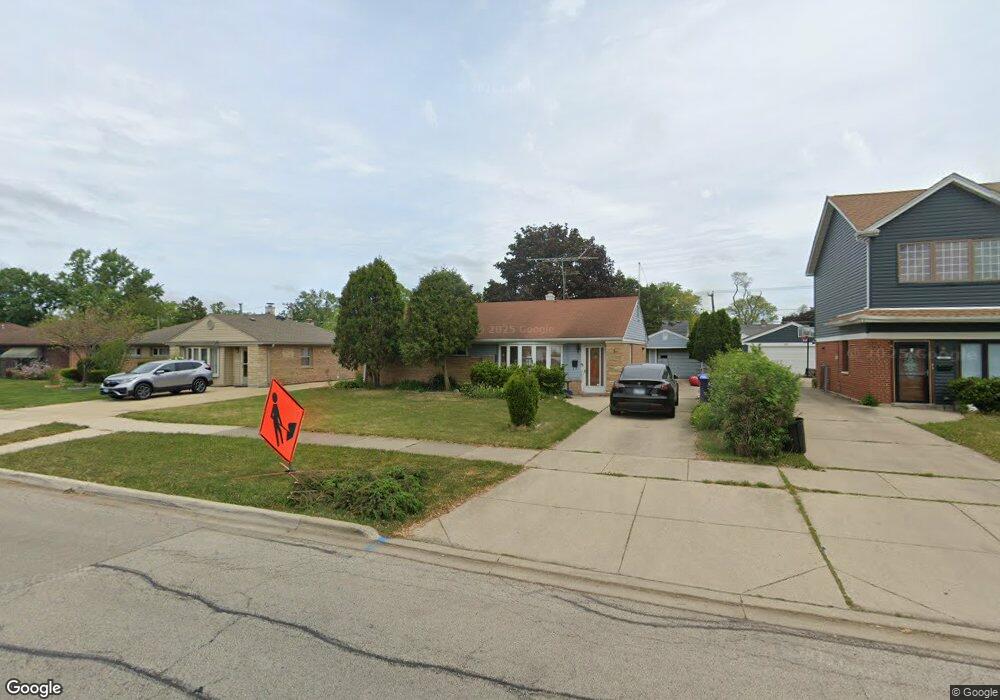
1155 S 3rd Ave Des Plaines, IL 60016
Estimated Value: $328,000 - $351,000
3
Beds
2
Baths
1,245
Sq Ft
$275/Sq Ft
Est. Value
About This Home
This home is located at 1155 S 3rd Ave, Des Plaines, IL 60016 and is currently estimated at $342,124, approximately $274 per square foot. 1155 S 3rd Ave is a home located in Cook County with nearby schools including Forest Elementary School, Algonquin Middle School, and Maine West High School.
Ownership History
Date
Name
Owned For
Owner Type
Purchase Details
Closed on
Oct 31, 2022
Sold by
Smith Arabella Irene
Bought by
Smith Rendell J
Current Estimated Value
Home Financials for this Owner
Home Financials are based on the most recent Mortgage that was taken out on this home.
Original Mortgage
$120,000
Outstanding Balance
$116,920
Interest Rate
8.63%
Mortgage Type
New Conventional
Estimated Equity
$225,204
Purchase Details
Closed on
Dec 27, 2010
Sold by
Smith Arabel Irene
Bought by
Smith Arabella Irene and Trust #Ais-001
Purchase Details
Closed on
May 13, 1998
Sold by
Vanoostenbrugge Teunus and Vanoostenbrugge Diane
Bought by
Smith Arabella I
Home Financials for this Owner
Home Financials are based on the most recent Mortgage that was taken out on this home.
Original Mortgage
$130,036
Interest Rate
6.79%
Mortgage Type
FHA
Create a Home Valuation Report for This Property
The Home Valuation Report is an in-depth analysis detailing your home's value as well as a comparison with similar homes in the area
Home Values in the Area
Average Home Value in this Area
Purchase History
| Date | Buyer | Sale Price | Title Company |
|---|---|---|---|
| Smith Rendell J | $200,000 | None Listed On Document | |
| Smith Arabella Irene | -- | Attorneys Title Guaranty Fun | |
| Smith Arabella I | -- | -- |
Source: Public Records
Mortgage History
| Date | Status | Borrower | Loan Amount |
|---|---|---|---|
| Open | Smith Rendell J | $120,000 | |
| Previous Owner | Smith Arabella I | $130,036 |
Source: Public Records
Tax History
| Year | Tax Paid | Tax Assessment Tax Assessment Total Assessment is a certain percentage of the fair market value that is determined by local assessors to be the total taxable value of land and additions on the property. | Land | Improvement |
|---|---|---|---|---|
| 2025 | $8,701 | $37,000 | $8,073 | $28,927 |
| 2024 | $8,701 | $33,001 | $6,728 | $26,273 |
| 2023 | $6,907 | $33,001 | $6,728 | $26,273 |
| 2022 | $6,907 | $33,001 | $6,728 | $26,273 |
| 2021 | $2,804 | $27,924 | $5,382 | $22,542 |
| 2020 | $2,568 | $27,924 | $5,382 | $22,542 |
| 2019 | $2,528 | $31,027 | $5,382 | $25,645 |
| 2018 | $2,814 | $19,266 | $4,709 | $14,557 |
| 2017 | $2,716 | $19,266 | $4,709 | $14,557 |
| 2016 | $3,310 | $19,266 | $4,709 | $14,557 |
| 2015 | $3,783 | $17,050 | $4,036 | $13,014 |
| 2014 | $3,626 | $17,050 | $4,036 | $13,014 |
| 2013 | $3,077 | $17,050 | $4,036 | $13,014 |
Source: Public Records
Map
Nearby Homes
- 1048 E Walnut Ave
- 1164 W Grant Dr
- 1394 Carol Ln
- 674 E Algonquin Rd
- 980 W Grant Dr
- 1458 Kingston Ct
- 1205 S Wolf Rd
- 886 E Thacker St
- 1122 Alfini Dr
- 1080 Bogart St
- 1277 E Thacker St Unit 303
- 1107 E Prairie Ave
- 1380 Oakwood Ave Unit 306
- 900 Center St Unit 3A
- 815 E Oakton St Unit 311
- 787 Graceland Ave Unit 202B
- 652 E Prairie Ave
- 905 Center St Unit B208
- 664 E Oakton St
- 505 Forest Ave
- 1149 S 3rd Ave
- 1167 S 3rd Ave
- 1139 S 3rd Ave
- 1160 Webster Ln
- 1152 Webster Ln
- 1166 Webster Ln
- 1144 Webster Ln
- 1174 Webster Ln
- 906 E Algonquin Rd
- 893 Walnut Ct
- 1140 Webster Ln
- 1182 Webster Ln
- 1142 S 3rd Ave
- 930 E Algonquin Rd
- 1121 S 3rd Ave
- 885 Walnut Ct
- 888 E Algonquin Rd
- 1128 Webster Ln
- 1134 S 3rd Ave
- 1120 Webster Ln
Your Personal Tour Guide
Ask me questions while you tour the home.