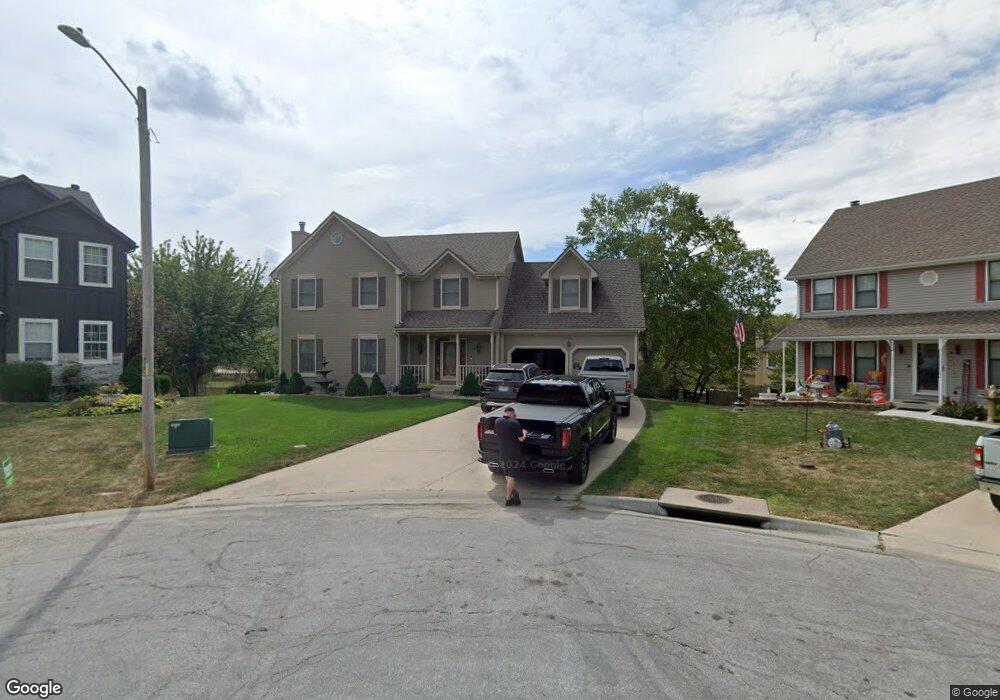
1156 SW Pacific Cir Lees Summit, MO 64081
Estimated Value: $421,000 - $473,000
4
Beds
5
Baths
2,300
Sq Ft
$192/Sq Ft
Est. Value
About This Home
This home is located at 1156 SW Pacific Cir, Lees Summit, MO 64081 and is currently estimated at $440,868, approximately $191 per square foot. 1156 SW Pacific Cir is a home located in Jackson County with nearby schools including Pleasant Lea Middle School, Lee's Summit Senior High School, and Summit Christian Academy.
Ownership History
Date
Name
Owned For
Owner Type
Purchase Details
Closed on
Jan 15, 2013
Sold by
Tidwell Verlon R and Tidwell Tonya A
Bought by
Tidwell Verlon R and Tidwell Tonya A
Current Estimated Value
Home Financials for this Owner
Home Financials are based on the most recent Mortgage that was taken out on this home.
Original Mortgage
$153,300
Outstanding Balance
$28,052
Interest Rate
2.67%
Mortgage Type
New Conventional
Estimated Equity
$412,816
Purchase Details
Closed on
Mar 6, 2003
Sold by
Tidwell Shanie M
Bought by
Tidwell Verlon R
Purchase Details
Closed on
Aug 22, 1995
Sold by
Spellerberg Construction Inc
Bought by
Tidwell Verlon R and Tidwell Shanie M
Home Financials for this Owner
Home Financials are based on the most recent Mortgage that was taken out on this home.
Original Mortgage
$123,500
Interest Rate
7.39%
Mortgage Type
Purchase Money Mortgage
Create a Home Valuation Report for This Property
The Home Valuation Report is an in-depth analysis detailing your home's value as well as a comparison with similar homes in the area
Home Values in the Area
Average Home Value in this Area
Purchase History
| Date | Buyer | Sale Price | Title Company |
|---|---|---|---|
| Tidwell Verlon R | -- | Secured Title Of Kansas City | |
| Tidwell Verlon R | -- | -- | |
| Tidwell Verlon R | -- | Coffelt Land Title Inc |
Source: Public Records
Mortgage History
| Date | Status | Borrower | Loan Amount |
|---|---|---|---|
| Open | Tidwell Verlon R | $153,300 | |
| Closed | Tidwell Verlon R | $123,500 |
Source: Public Records
Tax History Compared to Growth
Tax History
| Year | Tax Paid | Tax Assessment Tax Assessment Total Assessment is a certain percentage of the fair market value that is determined by local assessors to be the total taxable value of land and additions on the property. | Land | Improvement |
|---|---|---|---|---|
| 2025 | $5,682 | $62,316 | $9,711 | $52,605 |
| 2024 | $5,682 | $78,685 | $9,086 | $69,599 |
| 2023 | $5,640 | $78,684 | $10,518 | $68,166 |
| 2022 | $3,804 | $47,120 | $5,478 | $41,642 |
| 2021 | $3,883 | $47,120 | $5,478 | $41,642 |
| 2020 | $3,926 | $47,178 | $5,478 | $41,700 |
| 2019 | $3,818 | $47,178 | $5,478 | $41,700 |
| 2018 | $3,581 | $41,059 | $4,767 | $36,292 |
| 2017 | $3,501 | $41,059 | $4,767 | $36,292 |
| 2016 | $3,501 | $39,729 | $4,617 | $35,112 |
| 2014 | -- | $35,476 | $4,630 | $30,846 |
Source: Public Records
Map
Nearby Homes
- 1152 SW Pacific Cir
- 1025 SW Pacific Dr
- 1016 SW Pacific Dr
- 1021 SW Redbuck Cir
- 1052 SW Twin Creek Dr
- 1123 SW Hoke Dr
- 949 SW Daney Dr
- 804 SW Murray Rd
- 907 SW Lea Dr
- 701 SW Ward Rd
- 3053 NW Thoreau Ln
- 420 NW Kaylea Ct
- 1521 SW Hedgewood Ln
- 1402 SW Charleston Ave
- 1009 SW 8th St
- 1608 SW Hedgewood Ln
- 1011 SW Lorman Dr
- 505 SW Murray Rd
- 1508 SW 5th St
- 306 SW Mil-Mar Ave
- 1160 SW Pacific Cir
- 1164 SW Pacific Cir
- 1148 SW Pacific Cir
- 1155 SW Santa fe Dr
- 1144 SW Pacific Dr
- 1151 SW Santa fe Dr
- 1159 SW Santa fe Dr
- 1204 SW Pacific Dr
- 1175 SW Santa fe Dr
- 1167 SW Santa fe Dr
- 1228 SW Persels Rd
- 1147 SW Santa fe Dr
- 1224 SW Persels Rd
- 1208 SW Pacific Dr
- 1140 SW Pacific Dr
- 1212 SW Pacific Dr
- 1143 SW Santa fe Dr
- 1220 SW Persels Rd
- 1154 SW Santa fe Dr
- 1136 SW Pacific Dr