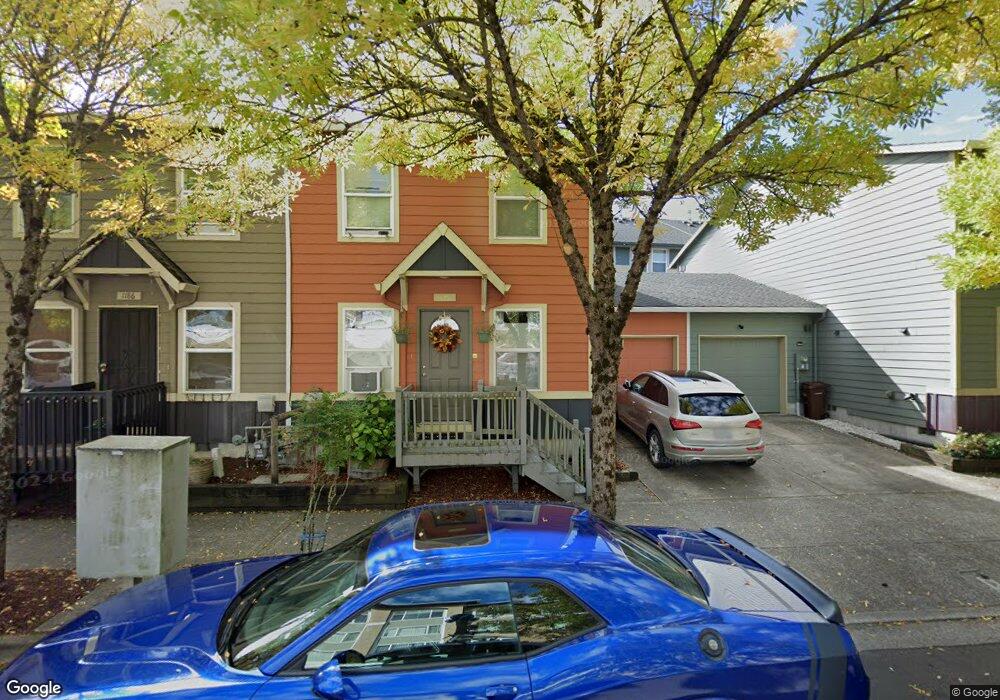
1158 NE 5th St Gresham, OR 97030
Downtown Gresham NeighborhoodEstimated Value: $343,000 - $356,000
3
Beds
4
Baths
1,569
Sq Ft
$223/Sq Ft
Est. Value
About This Home
This home is located at 1158 NE 5th St, Gresham, OR 97030 and is currently estimated at $349,934, approximately $223 per square foot. 1158 NE 5th St is a home located in Multnomah County with nearby schools including East Gresham Elementary School, Dexter McCarty Middle School, and Gresham High School.
Ownership History
Date
Name
Owned For
Owner Type
Purchase Details
Closed on
Mar 27, 2016
Sold by
U S Bank Trust Na
Bought by
Vander Meer Gesine
Current Estimated Value
Home Financials for this Owner
Home Financials are based on the most recent Mortgage that was taken out on this home.
Original Mortgage
$166,500
Interest Rate
3.73%
Mortgage Type
New Conventional
Purchase Details
Closed on
Feb 1, 2016
Sold by
Carlos Camilo
Bought by
U S Bank Trust Na and Lsf9 Master Participation Trust
Home Financials for this Owner
Home Financials are based on the most recent Mortgage that was taken out on this home.
Original Mortgage
$166,500
Interest Rate
3.73%
Mortgage Type
New Conventional
Purchase Details
Closed on
Dec 3, 2008
Sold by
Libertybank
Bought by
Carlos Camilo
Home Financials for this Owner
Home Financials are based on the most recent Mortgage that was taken out on this home.
Original Mortgage
$166,920
Interest Rate
5.02%
Mortgage Type
FHA
Create a Home Valuation Report for This Property
The Home Valuation Report is an in-depth analysis detailing your home's value as well as a comparison with similar homes in the area
Home Values in the Area
Average Home Value in this Area
Purchase History
| Date | Buyer | Sale Price | Title Company |
|---|---|---|---|
| Vander Meer Gesine | $198,900 | First American | |
| U S Bank Trust Na | $157,555 | None Available | |
| Carlos Camilo | $170,000 | First American |
Source: Public Records
Mortgage History
| Date | Status | Borrower | Loan Amount |
|---|---|---|---|
| Closed | Vander Meer Gesine | $166,500 | |
| Previous Owner | Carlos Camilo | $166,920 |
Source: Public Records
Tax History
| Year | Tax Paid | Tax Assessment Tax Assessment Total Assessment is a certain percentage of the fair market value that is determined by local assessors to be the total taxable value of land and additions on the property. | Land | Improvement |
|---|---|---|---|---|
| 2025 | $3,676 | $180,660 | -- | -- |
| 2024 | $3,519 | $175,400 | -- | -- |
| 2023 | $3,519 | $170,300 | -- | -- |
| 2022 | $3,117 | $165,340 | $0 | $0 |
| 2021 | $3,038 | $160,530 | $0 | $0 |
| 2020 | $2,859 | $155,860 | $0 | $0 |
| 2019 | $2,784 | $151,330 | $0 | $0 |
| 2018 | $2,655 | $146,930 | $0 | $0 |
| 2017 | $2,547 | $142,660 | $0 | $0 |
| 2016 | $2,246 | $138,510 | $0 | $0 |
| 2015 | $2,197 | $134,480 | $0 | $0 |
| 2014 | $2,144 | $130,570 | $0 | $0 |
Source: Public Records
Map
Nearby Homes
- 0 NE 6th St
- 894 NE Linden Ave
- 491 NE Elliott Ave
- 660 NE 9th St
- 4740 SE 2nd St
- 4764 SE 2nd St
- 4667 SE 2nd St
- 900 NE Francis Ave Unit 29
- 900 NE Francis Ave
- 900 NE Francis Ave Unit 63
- 1302 NE Hogan Dr
- 1308 NE Hogan Dr Unit 166
- 318 NE Roberts Ave Unit 308
- 318 NE Roberts Ave Unit 203
- 1715 SE 5th St Unit 1725
- 0 NE 5th St
- 1514 NE Hogan Dr Unit 131
- 579 NE Fleming Ave Unit C41
- 863 NE Fleming Ave Unit B10
- 450 SE Hogan Rd
- 1150 NE 5th St
- 1166 NE 5th St
- 1142 NE 5th St
- 1174 NE 5th St Unit A1
- 1134 NE 5th St Unit 60
- 1182 NE 5th St Unit A1
- 1126 NE 5th St Unit 59
- 1190 NE 5th St Unit A1
- 1120 NE 5th St Unit 58
- 1149 NE 5th St
- 1163 NE 5th St
- 1177 NE 5th St
- 1157 NE 5th St
- 1141 NE 5th St
- 1181 NE 5th St
- 1110 NE 5th St
- 1110 NE 5th St Unit 57
- 1189 NE 5th St
- 1197 NE 5th St
- 1133 NE 5th St
Your Personal Tour Guide
Ask me questions while you tour the home.